
- BTC liquidation levels and pwEQ could be key for potential bounces.
- The 50 & 200-Day Moving Averages forming a Golden Cross.
Bitcoin [BTC], the most dominant digital asset, continues to attract attention, with its price drawing significant analysis.
With the current market momentum, traders are actively seeking opportunities, especially in zones with high risk-to-reward ratio.
Recently, Bitcoin surged during the weekly open, creating two major long liquidation levels due to high leverage, which aligned perfectly with last week’s equilibrium (pwEQ).
The pump faced resistance as the bid-ask ratio tilted heavily toward the ask side. This led to a retracement, bringing BTC back to critical levels, making these liquidation points and pwEQ key areas for potential price bounces.
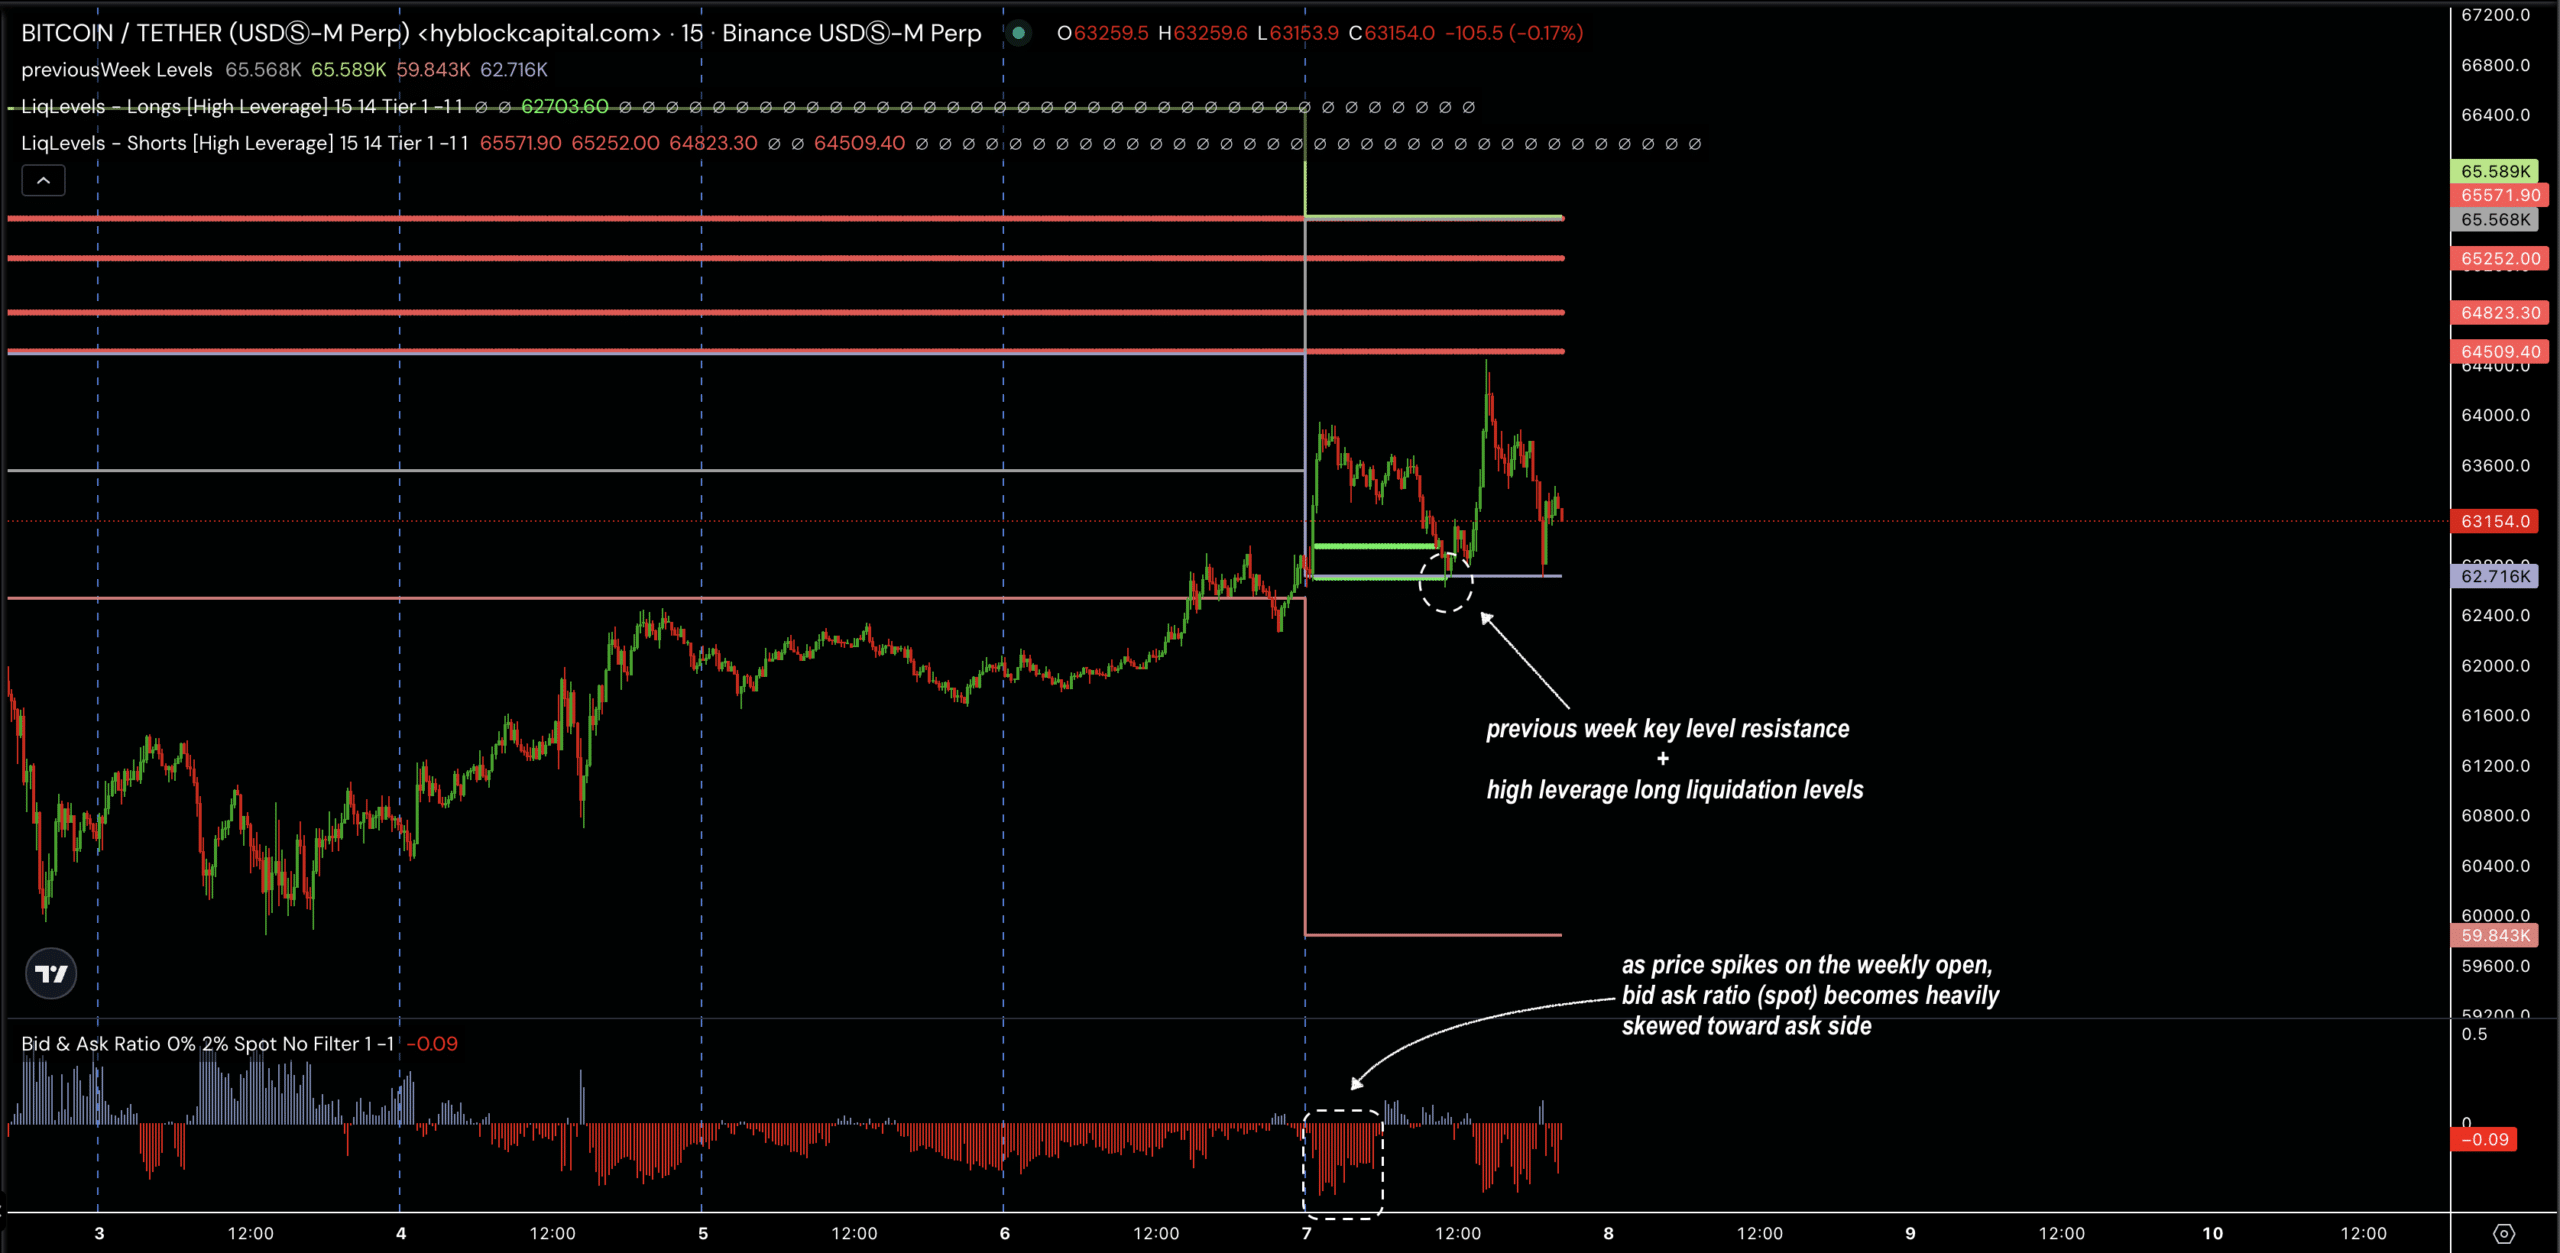
Source: Hyblock Capital
The bid-ask ratio is now showing a shift toward demand, with more bids appearing within 2% of the current price.
This indicates that entry levels around $62K to $63K could offer high returns if Bitcoin continues its upward momentum.
Looking further into BTC/USD price action, the $62K to $63K zone is emerging as a crucial level.
The 50-day and 200-day MAs are nearing a golden cross formation, a bullish signal indicating potential upward momentum.
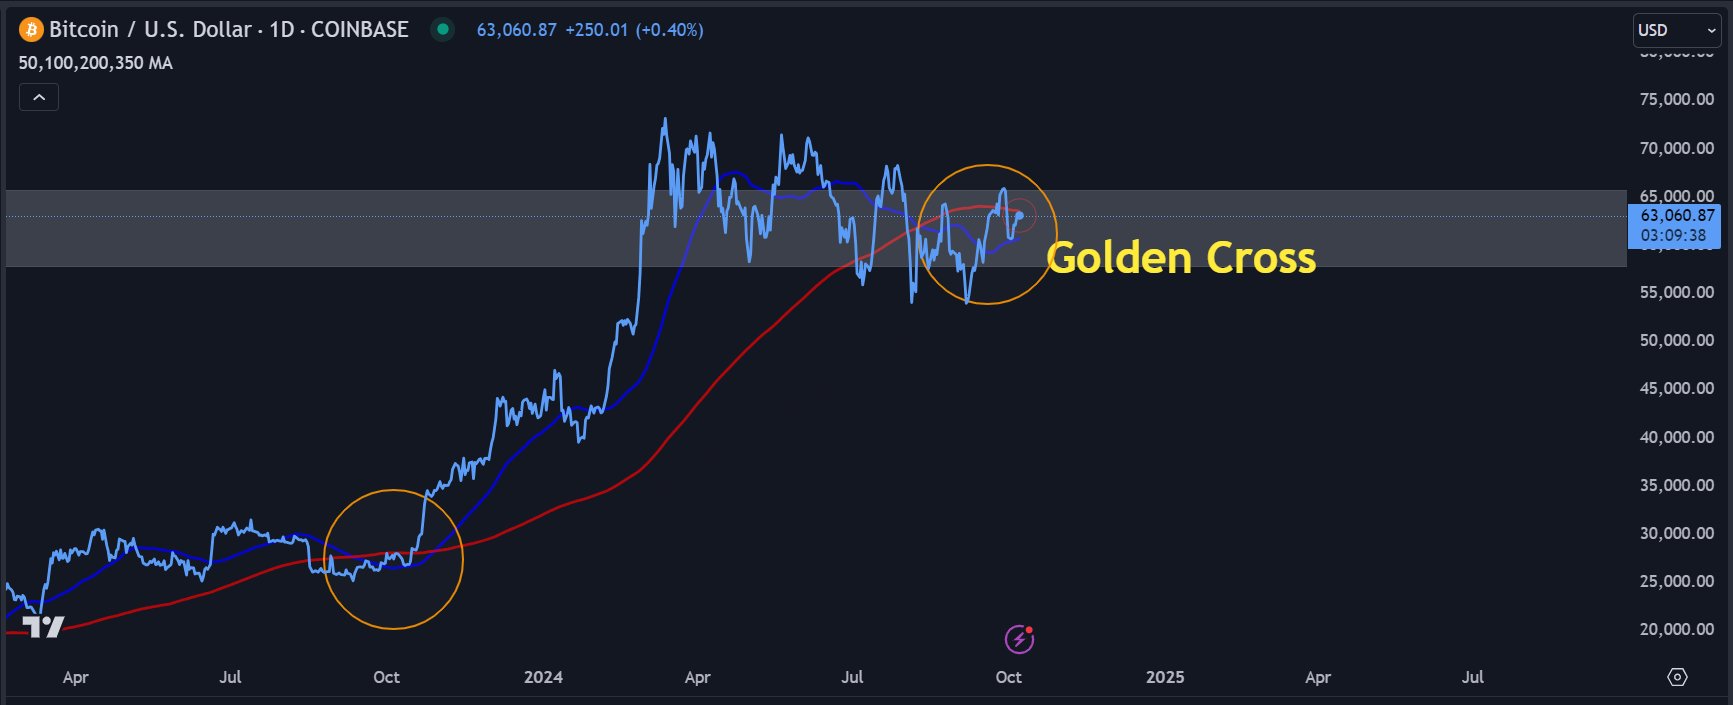
Source: TradingView
This pattern, combined with the liquidation levels and pwEQ alignment, strengthens the argument for further gains.
The last time a similar golden cross occurred was last year, which preceded a significant bullish run, hinting that a breakout could be near as bulls take control.
BTC supply and momentum
Additionally, analyzing short-term holder behavior reveals that weaker hands have been exiting the market. When Bitcoin’s price drops, short-term holders often panic-sell, typically locking in losses.
This is reflected in an increase in purple bars on the chart, marking sell-offs during downturns. As weak hands exit, Bitcoin shifts to stronger hands, potentially stabilizing the market.
The STH supply has declined significantly, especially after major sell-offs, suggesting that selling pressure has eased.
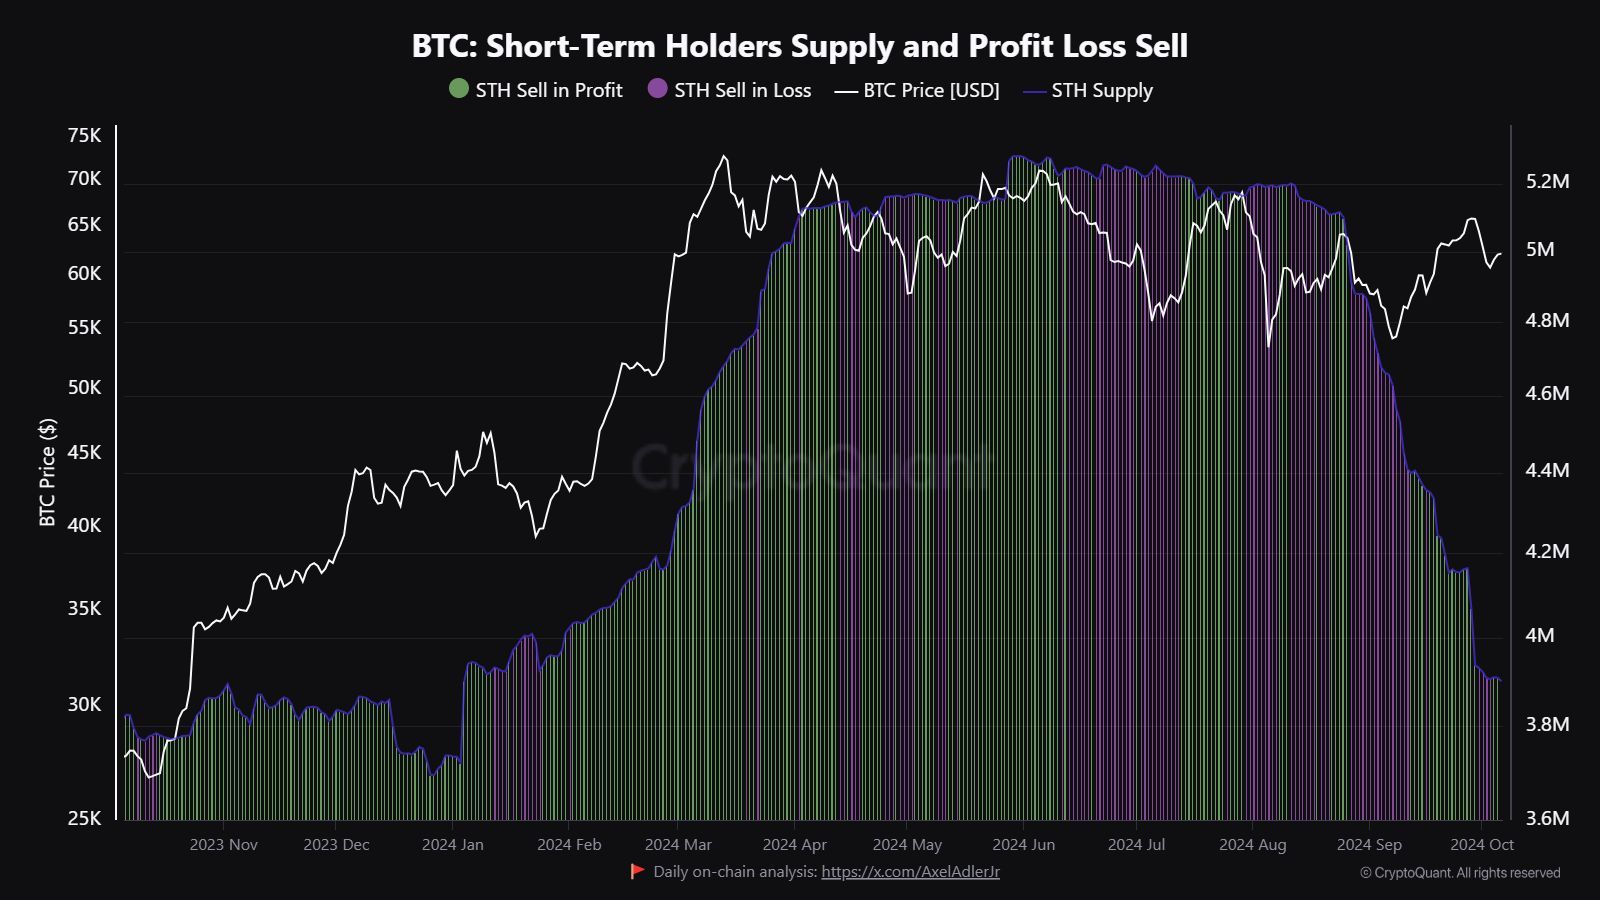
Source: CryptoQuant
This decline in supply could create favorable conditions for accumulation, further supporting the importance of the $62K — $63K zone for high risk-to-reward opportunities.
Lastly, the Momentum Short-Term Cap indicator, which measures the difference between Bitcoin’s market cap and realized cap over short-term periods, is showing signs of recovery, though slowly.
This ratio is a reliable indicator of market peaks for short-term holders, highlighting potential price thresholds.
While the current ratio indicates that the market is warming up, macroeconomic factors and slow recovery in momentum suggest that Bitcoin’s next major move may take time.
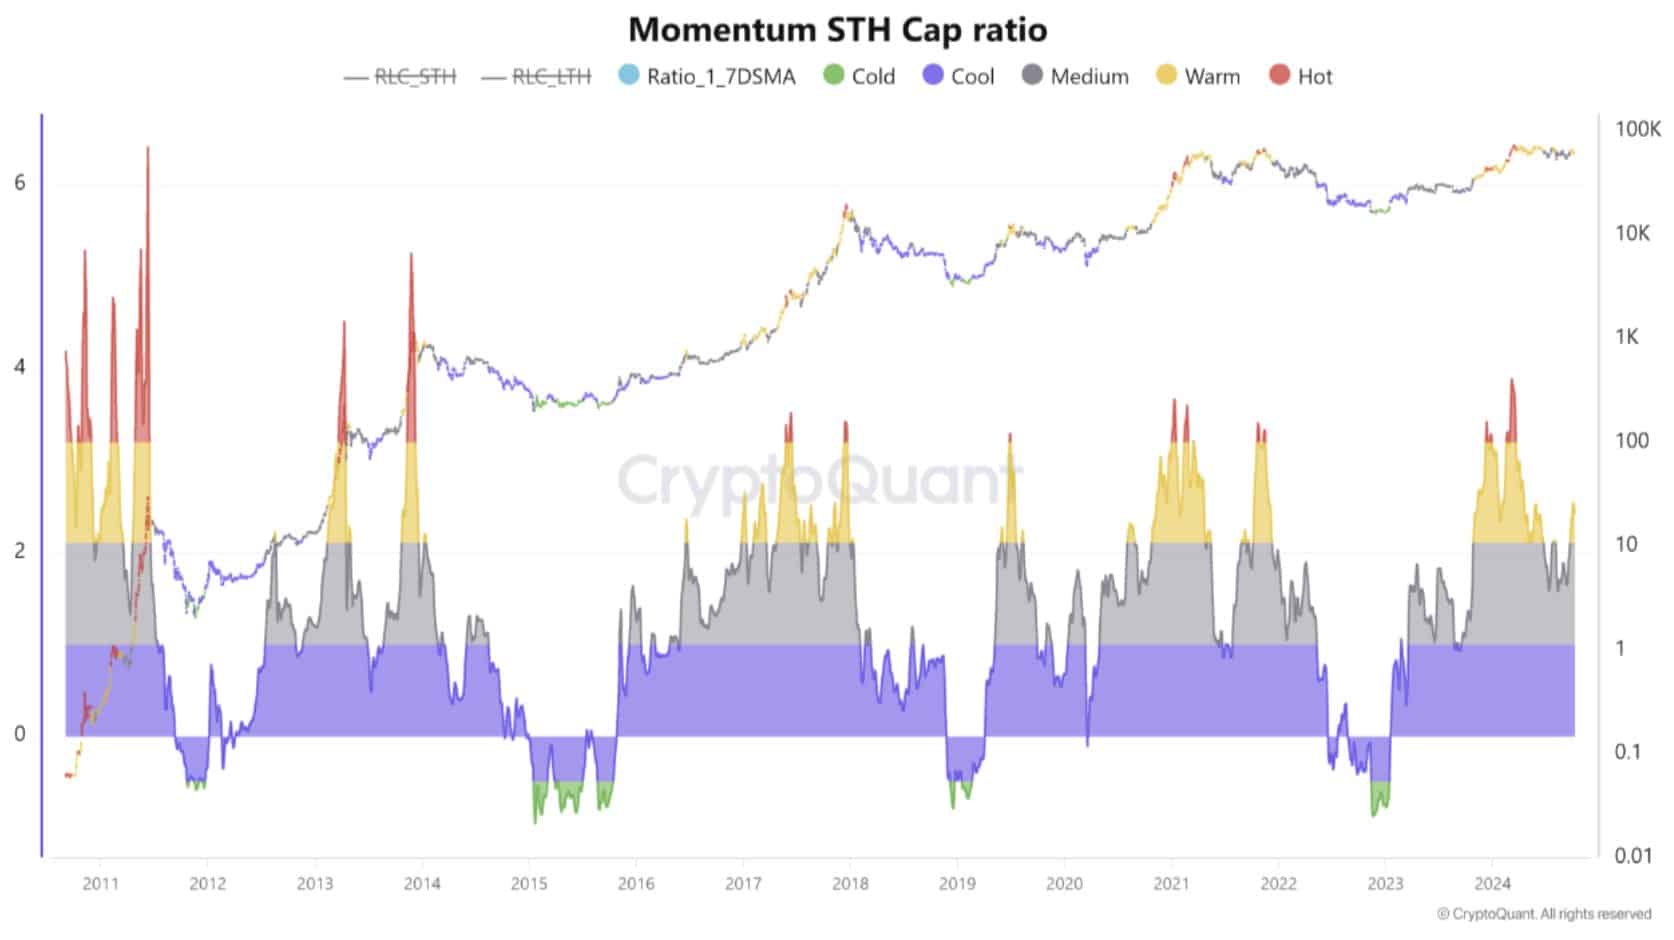
Source: CryptoQuant
However, once these conditions improve, momentum could return rapidly, potentially pushing Bitcoin’s price higher and signaling the top of the current cycle.
Read Bitcoin’s [BTC] Price Prediction 2024–2025
Bitcoin’s current price levels offer significant potential, especially with strong technical indicators like the golden cross and declining STH supply pointing toward a bullish outlook.
With momentum building, BTC could see higher prices in the coming months.