
- NEAR recently entered a symmetrical triangle formation, and a breakout to the upside could propel its towards $5.8
- Market sentiment largely bullish at press time, with a majority of traders showing confidence
Despite its recent bullishness, NEAR’s movement on the price chart has been fairly limited. It registered modest gains of just 0.14% over the last 24 hours and an uptick of 0.36% over a 7-day period.
This period is known as consolidation and it indicates that traders may be accumulating NEAR in anticipation of a major price move. In light of these findings, AMBCrypto took a closer look at the potential next steps for NEAR.
Support level is key to NEAR’s projected price swing
NEAR, at press time, was trading within a symmetrical triangle – A pattern formed by converging support and resistance lines. This formation alluded to a consolidation phase where buyers are steadily accumulating the asset.
If this pattern is broken to the upside, NEAR could potentially rally to the pattern’s peak of $5.871. However, before this upward move, NEAR will likely first test the $4.604 support level, which plays a crucial role in determining the next move.
Should this support at $4.604 fail to hold, NEAR could see a further decline, dropping below the pattern’s support boundary to a local support level – $4.248.
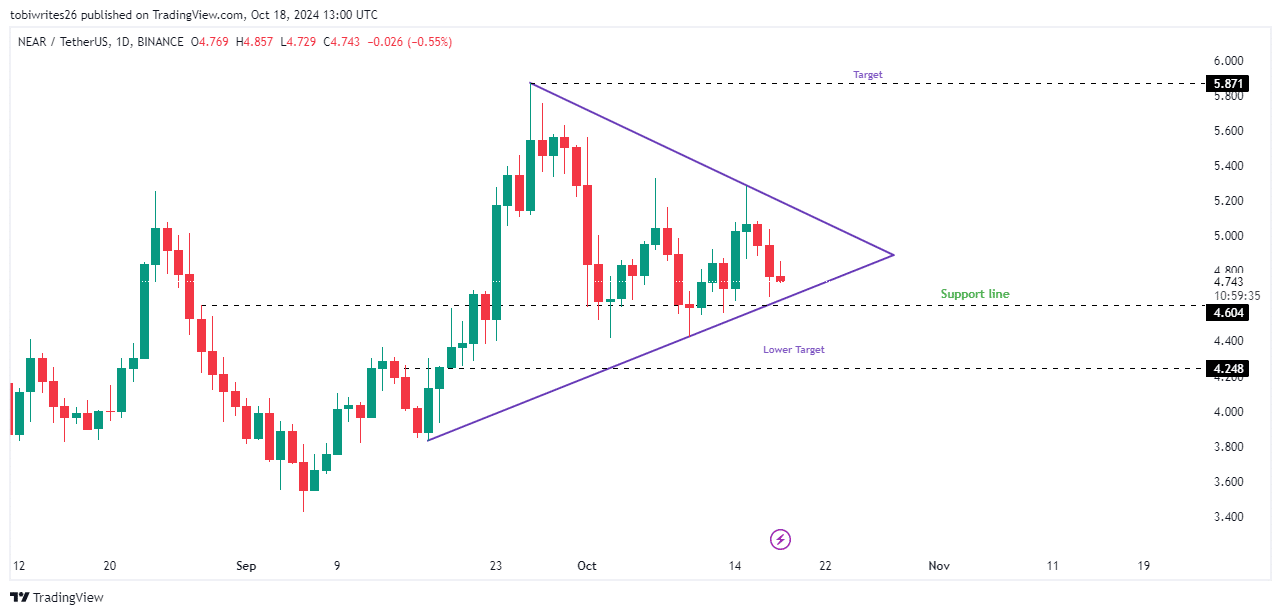
Source: Trading View
Indicators signal active buying for NEAR
Both the Parabolic SAR (Stop and Reverse) and the Relative Strength Index (RSI) suggested that NEAR may be primed for an upswing too.
The Parabolic SAR, with dotted markers forming below NEAR’s press time price, indicated ongoing buying pressure and a bullish trend. If these markers continue to multiply and extend beyond four in sequence, it will likely confirm NEAR’s sustained upward momentum.
Meanwhile, while the RSI seemed to be pointed south, it appeared bullish. It is expected to test the support trend line that has been pushing it forward, with NEAR’s price moving in tandem.
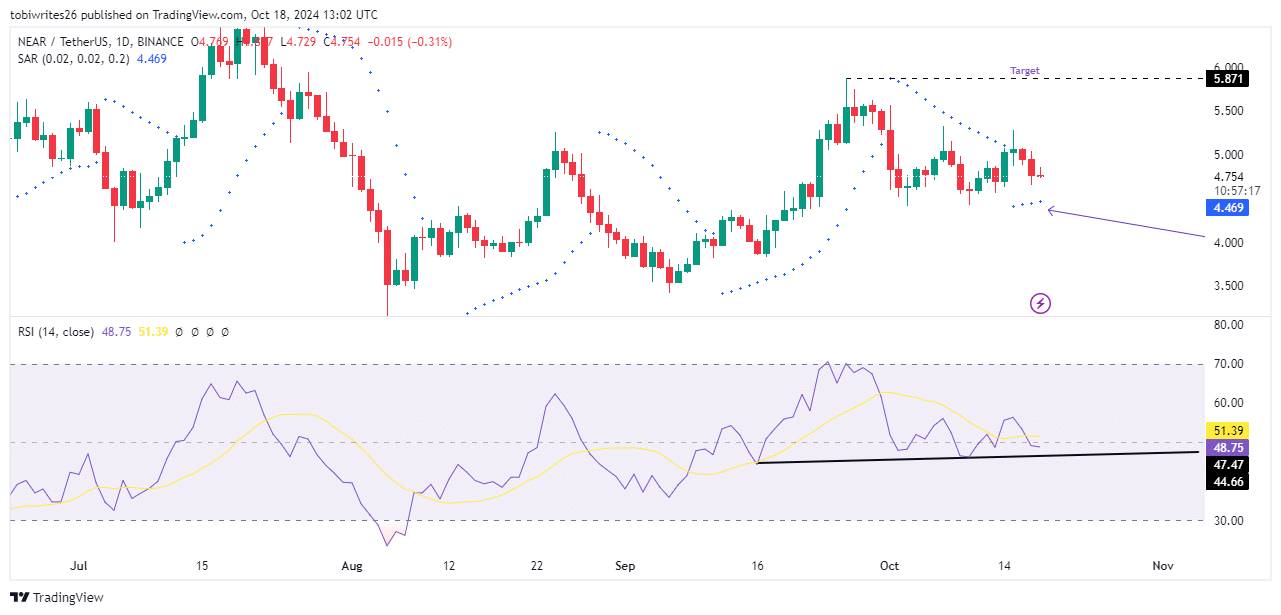
Source: Trading View
However, this short-term dip in RSI could lead to a price drop towards the $4.604 support level. From there, NEAR can be anticipated to reverse direction and resume its upward trajectory.
Massive liquidity outflows favor NEAR
NEAR has experienced significant outflows across exchanges, according to data from Coinglass.
Over the past seven days, NEAR saw netflows of $1.62 million, indicating a bullish outlook as investors moved assets off exchanges. Here, it’s worth pointing out that this is often an accumulation and long-term holding strategy.
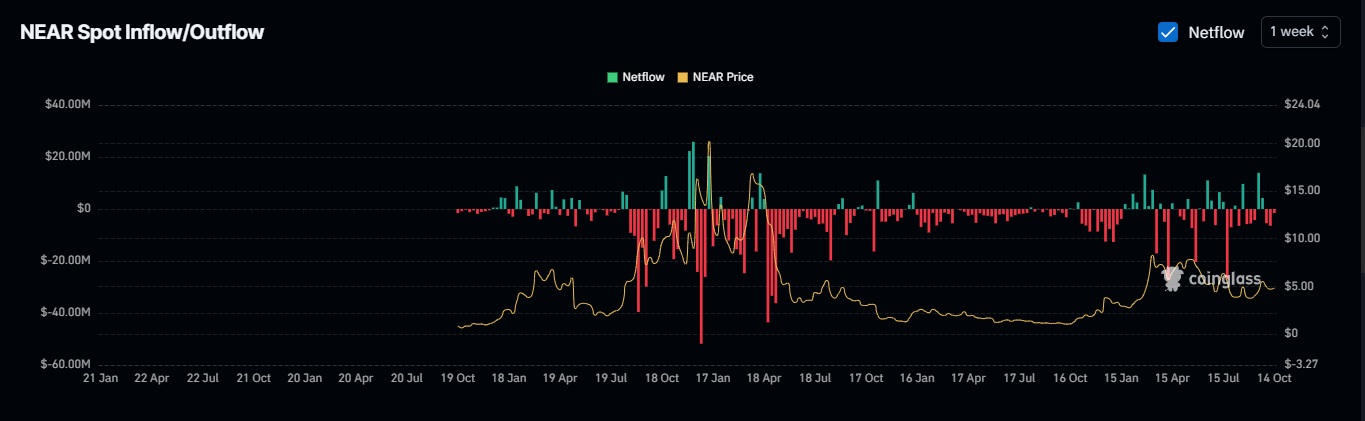
Source: Coinglass
If this trend of negative netflows continues over a broader timeframe, it would further confirm strong bullish sentiment.
By extension, it would point to a potential rally ahead, while reinforcing the overall health of NEAR’s ecosystem.