- SAFE has surged 76% in 24 hours, breaking out of a multi-month downtrend with strong volume.
- Social dominance has risen sharply, but overbought indicators and price divergence suggest caution.
Safe [SAFE] has soared, breaking free from its multi-month downtrend and skyrocketing over 76% in just 24 hours. At press time, SAFE was trading at $1.66, showing a significant increase in investor confidence.
Additionally, the market cap has surged by 76.69%, pushing its valuation to $770.48 million. The trading volume has jumped by an astounding 9981.24%, indicating heightened interest in the token’s recent performance.
These figures highlight the strength behind the current breakout. However, traders are now asking whether Safe can maintain this rapid growth or if a pullback is looming.
Breaking the downtrend: What happens next?
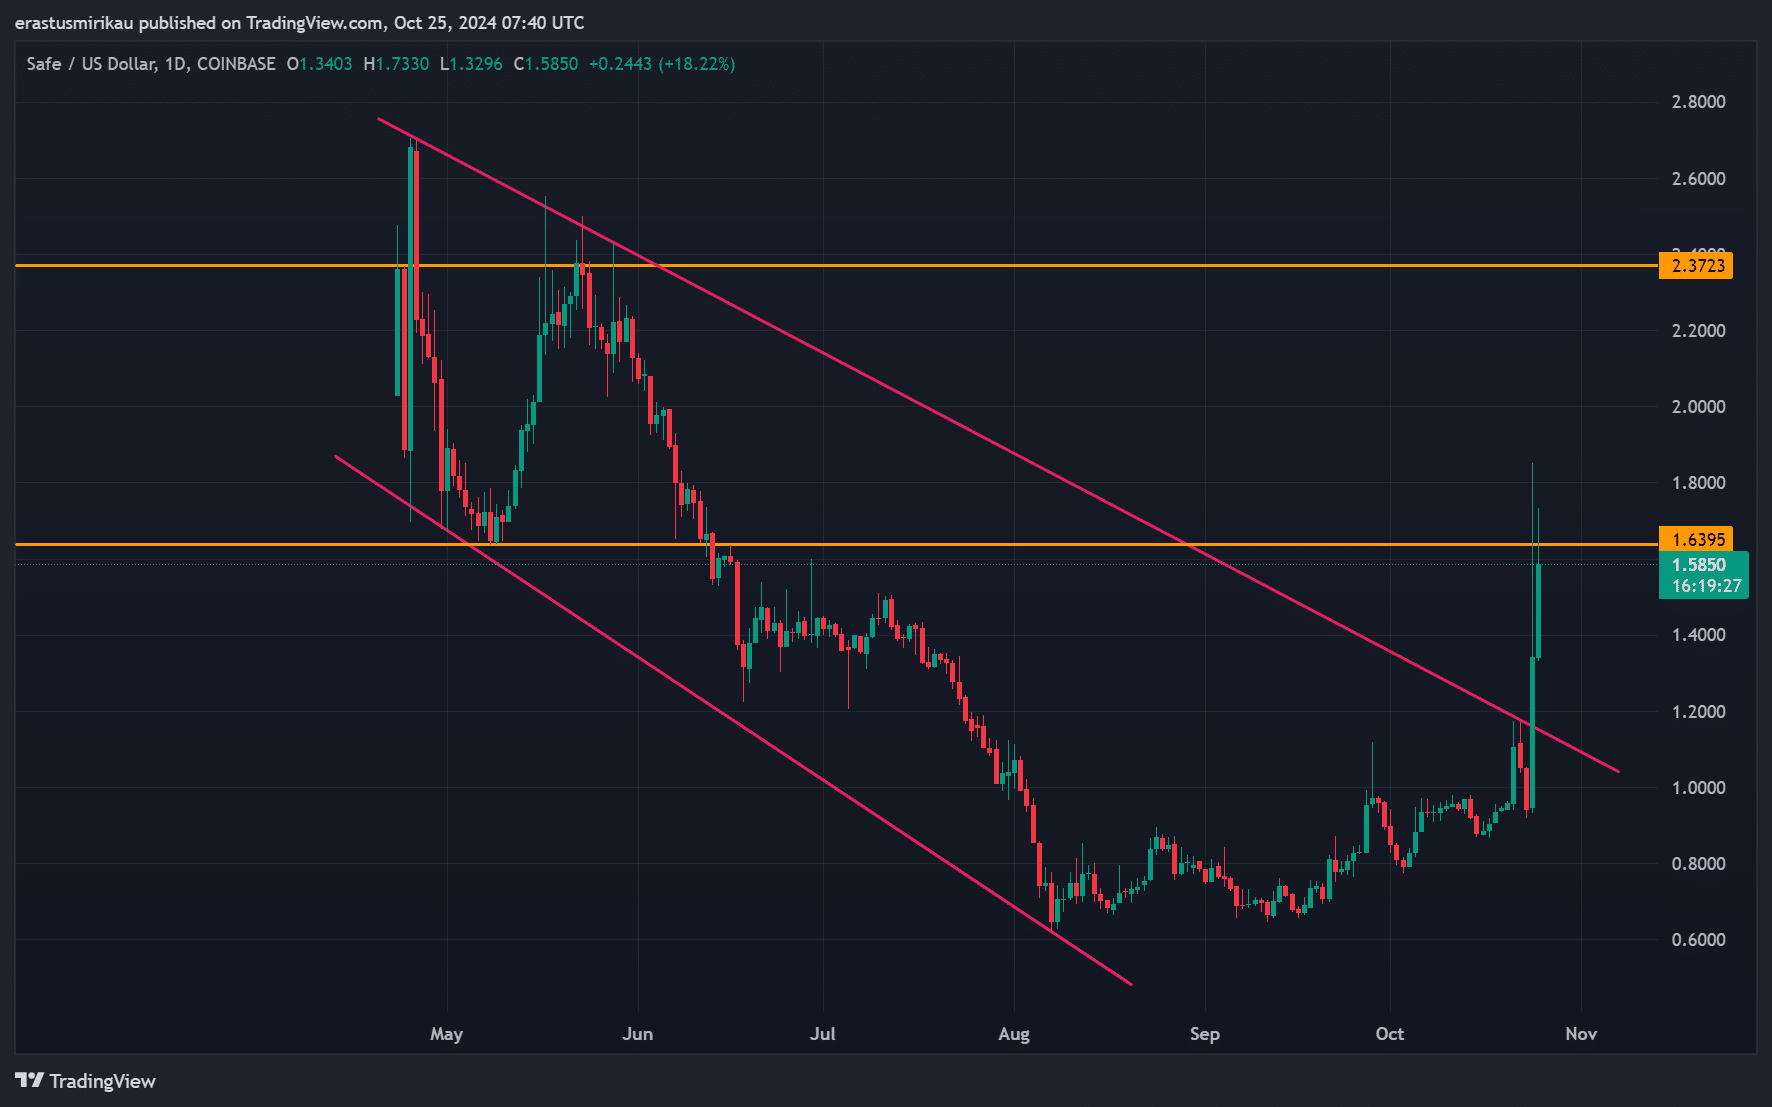
Safe has been in a long, drawn-out downtrend, caught in a descending channel since early this year. However, the price has now broken out of this structure, signaling a bullish reversal.
Currently, SAFE holds above $1.63, a key level that previously acted as resistance. Therefore, this level is now the main support that traders will monitor closely.
The next major hurdle lies at $2.37, a strong resistance level that SAFE needs to overcome to continue its rally. A break above this point would signal even more upward potential. Additionally, holding the $1.63 level would affirm that the bulls are still in control.

Source: TradingView
Technical indicators: RSI and MACD flash caution
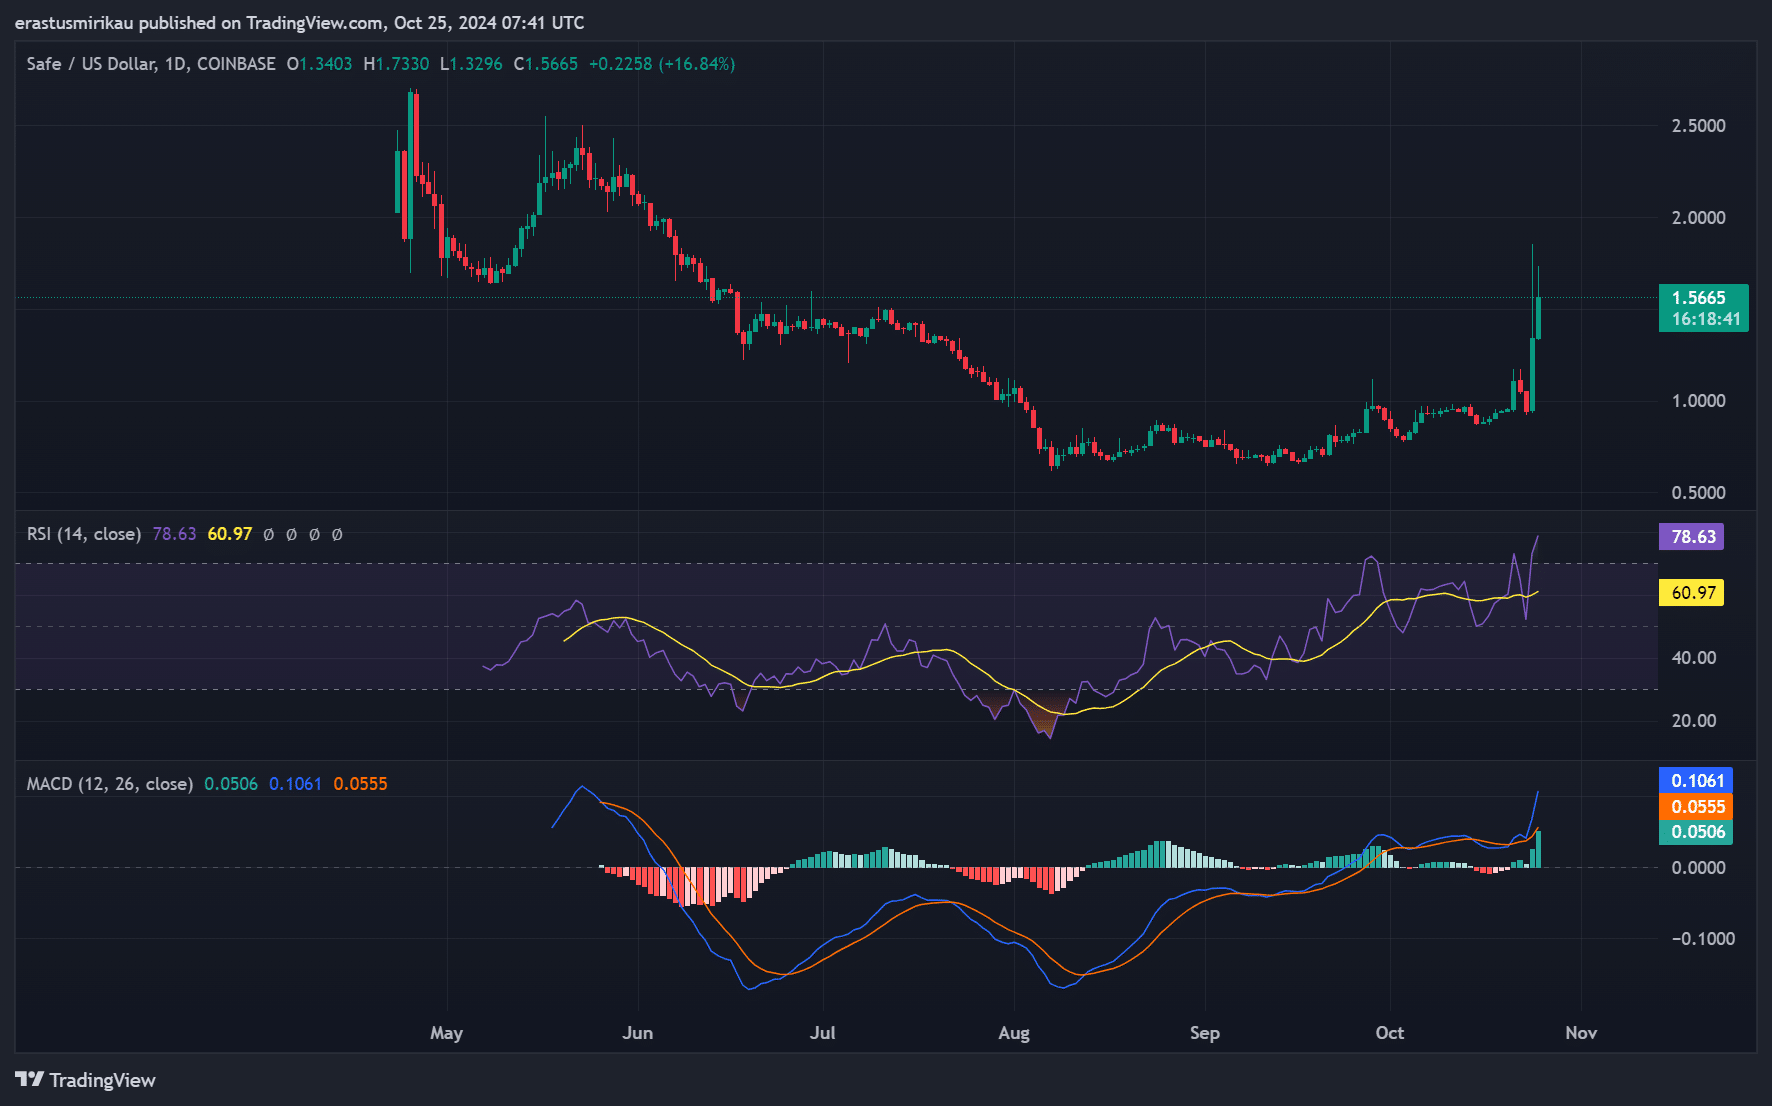
While the breakout is promising, several technical indicators suggest caution moving forward. The Relative Strength Index (RSI) currently sits at 78.63, placing it in overbought territory.
Therefore, SAFE may be due for a period of consolidation or even a short-term pullback.
Moreover, the MACD has crossed into bullish territory, with its signal line confirming continued momentum. However, the strength of the surge could mean a potential cooling off before the next upward leg.


Source: TradingView
Price DAA Divergence
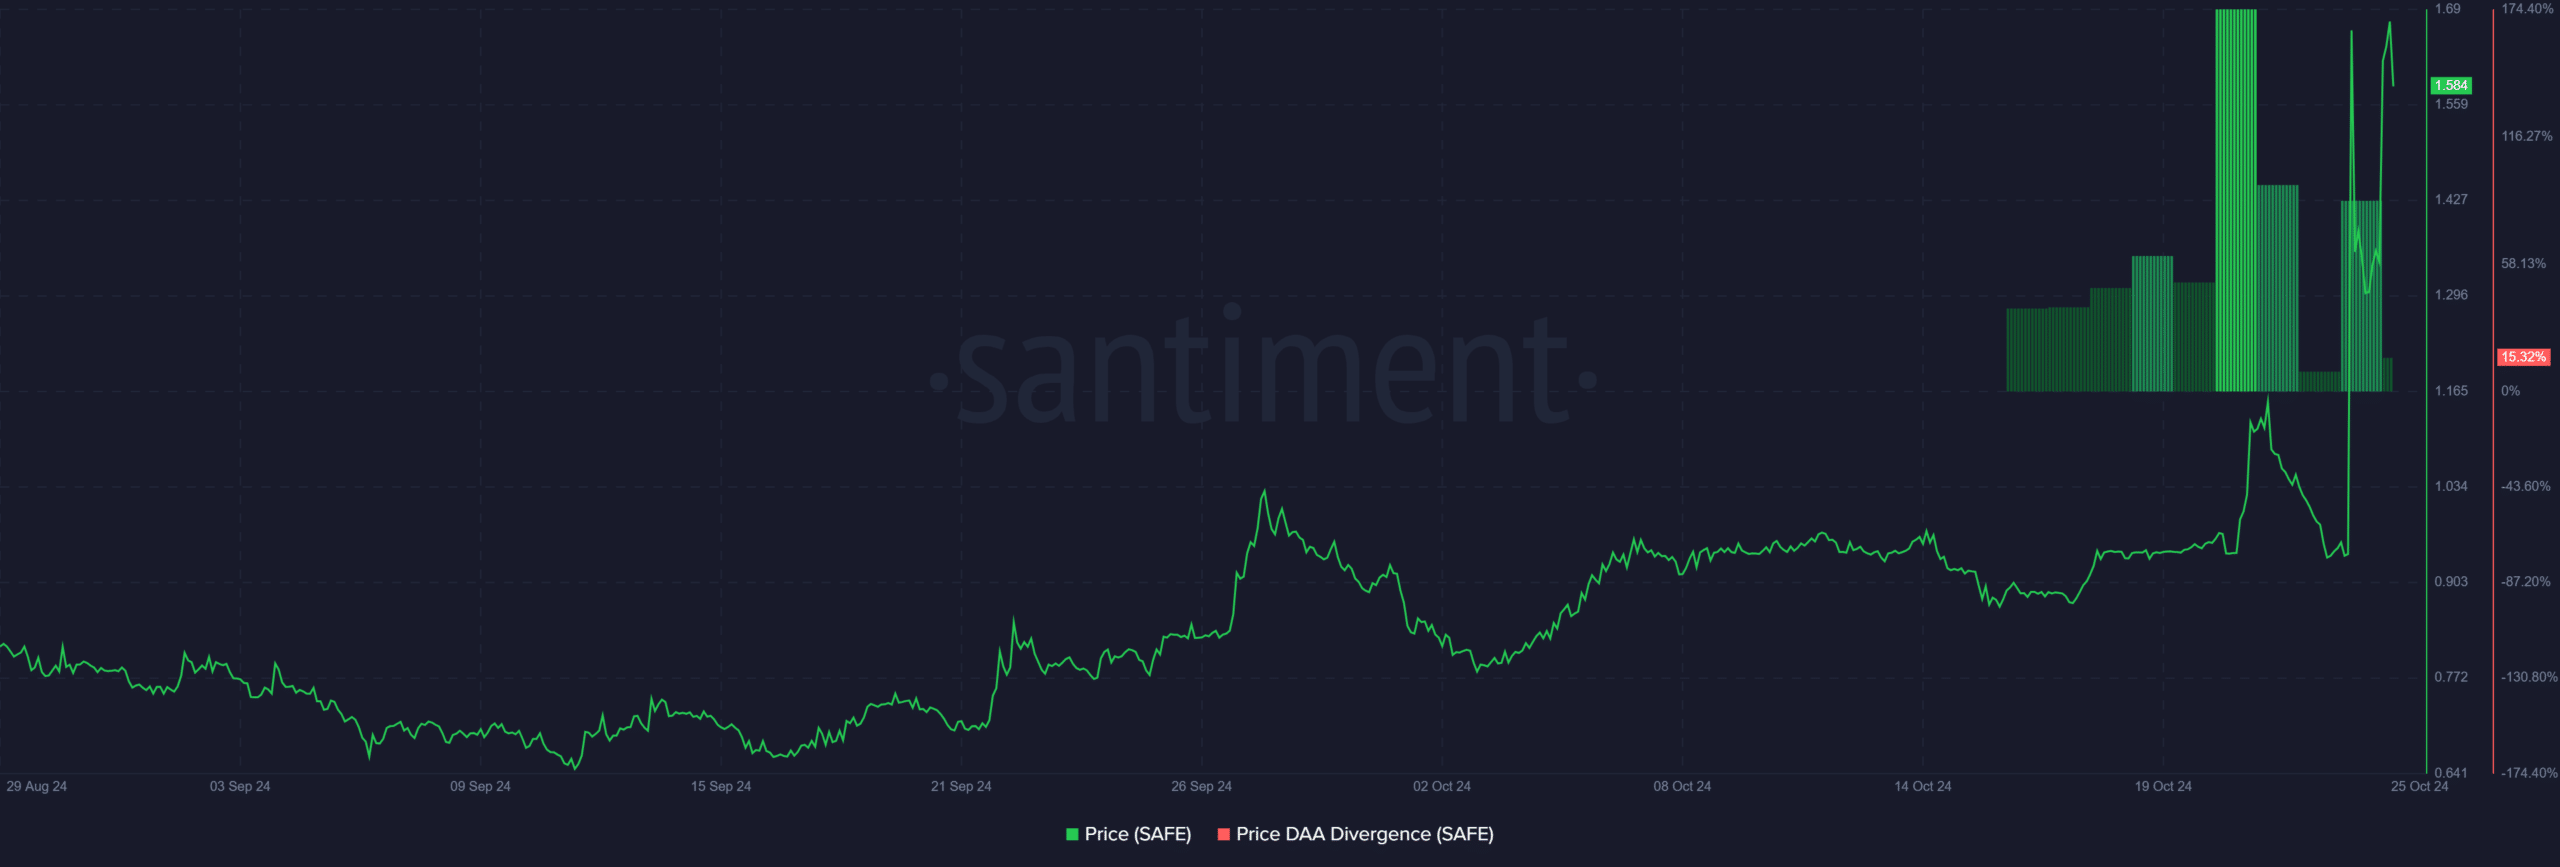
The Price DAA Divergence reveals a 15.32% gap between SAFE’s price surge and its network activity. While the price has increased significantly, daily active addresses have not risen proportionally.
The divergence indicates that the price movement could be speculative, driven by short-term traders rather than consistent network growth. This calls for caution, as a lack of organic network activity can sometimes result in a price correction.


Source: Santiment
SAFE social dominance spikes
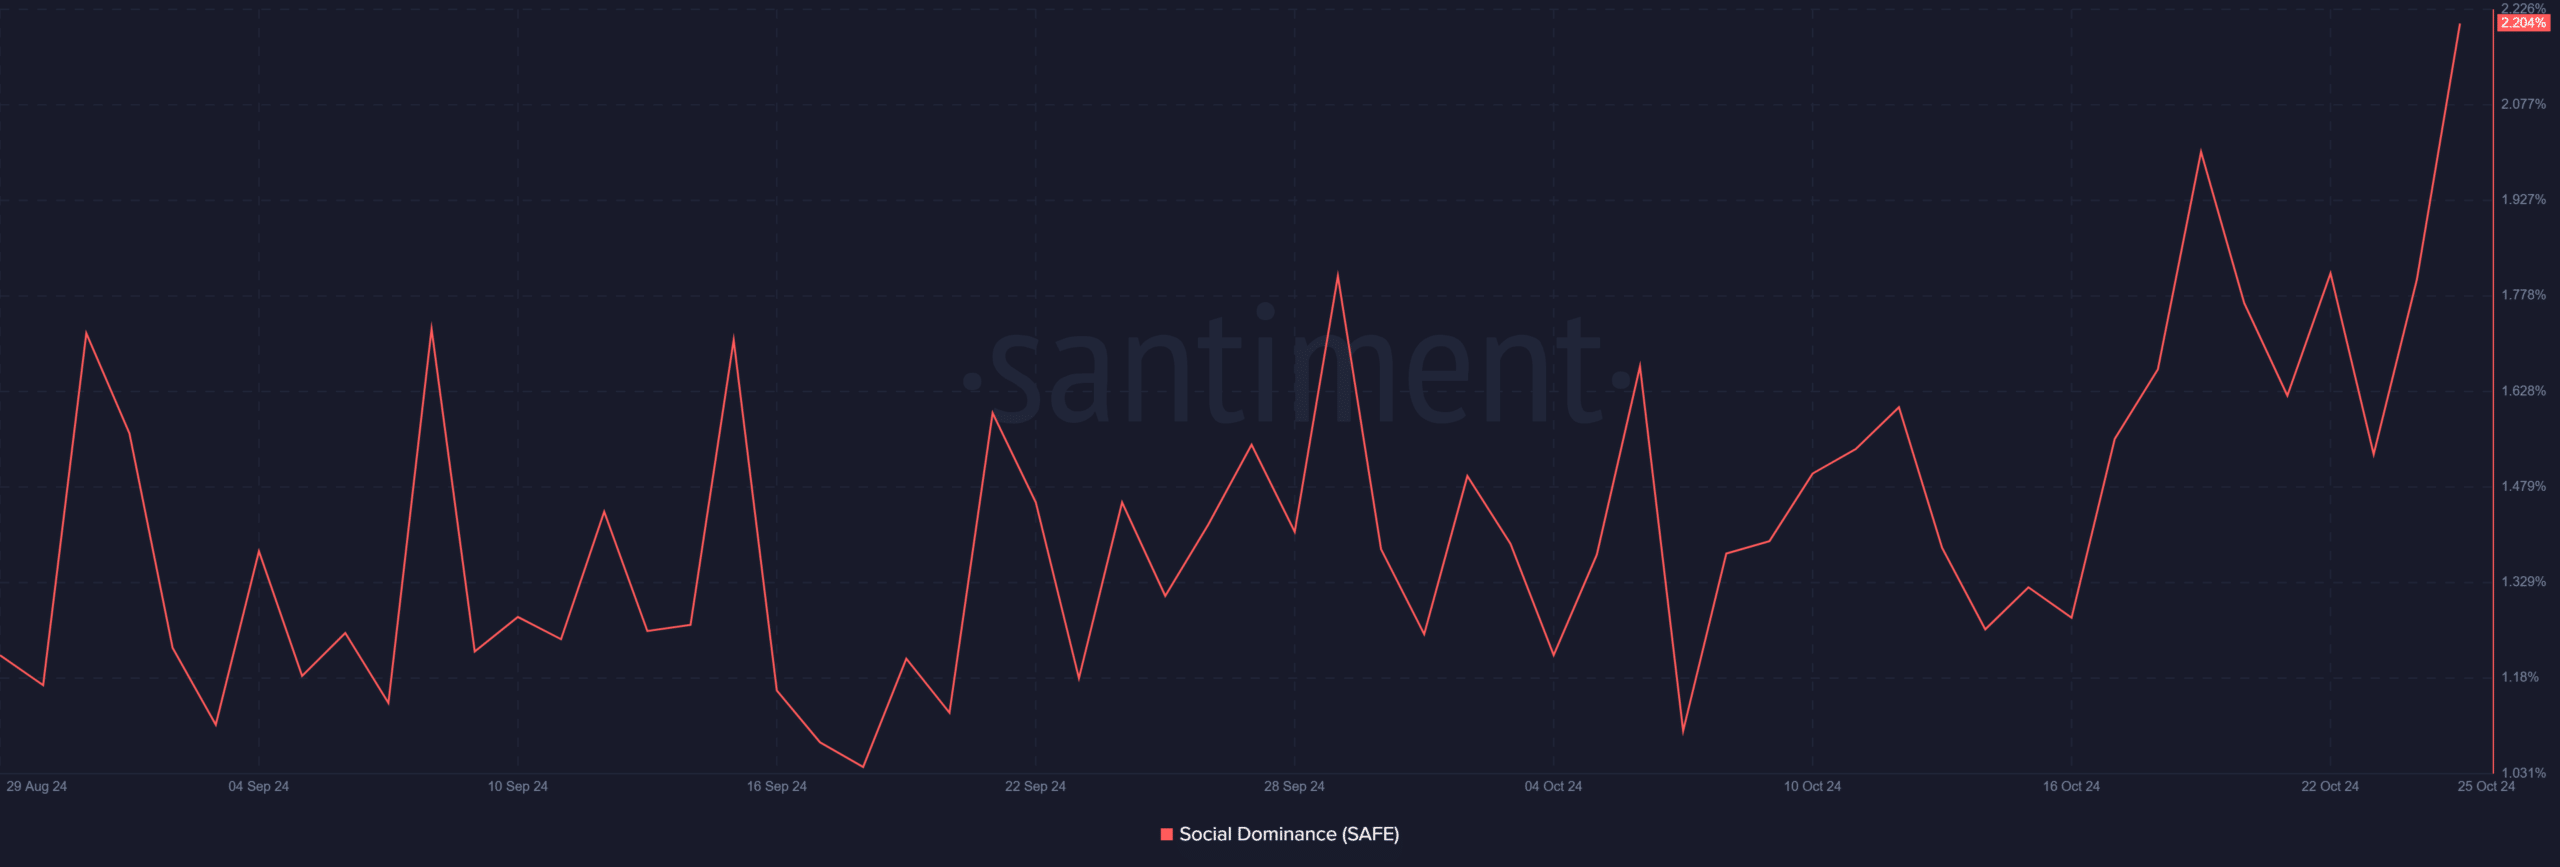
The social dominance has surged to 2.204%, a substantial increase from its earlier levels. Additionally, this spike highlights that SAFE is gaining significant attention on social media platforms, often a sign of increased volatility and price action.
However, sharp rises in social dominance don’t always translate into sustainable growth and can signal short-lived speculative interest.


Source: Santiment
Is SAFE poised to hit $2.37?
Considering the strong volume surge and the clear breakout from a multi-month downtrend, SAFE will likely hit the $2.37 resistance level soon.
The bullish momentum remains intact, supported by heightened social interest and technical indicators, despite overbought conditions. Therefore, unless a major pullback occurs, SAFE is well-positioned to test the $2.37 mark in the near term.

