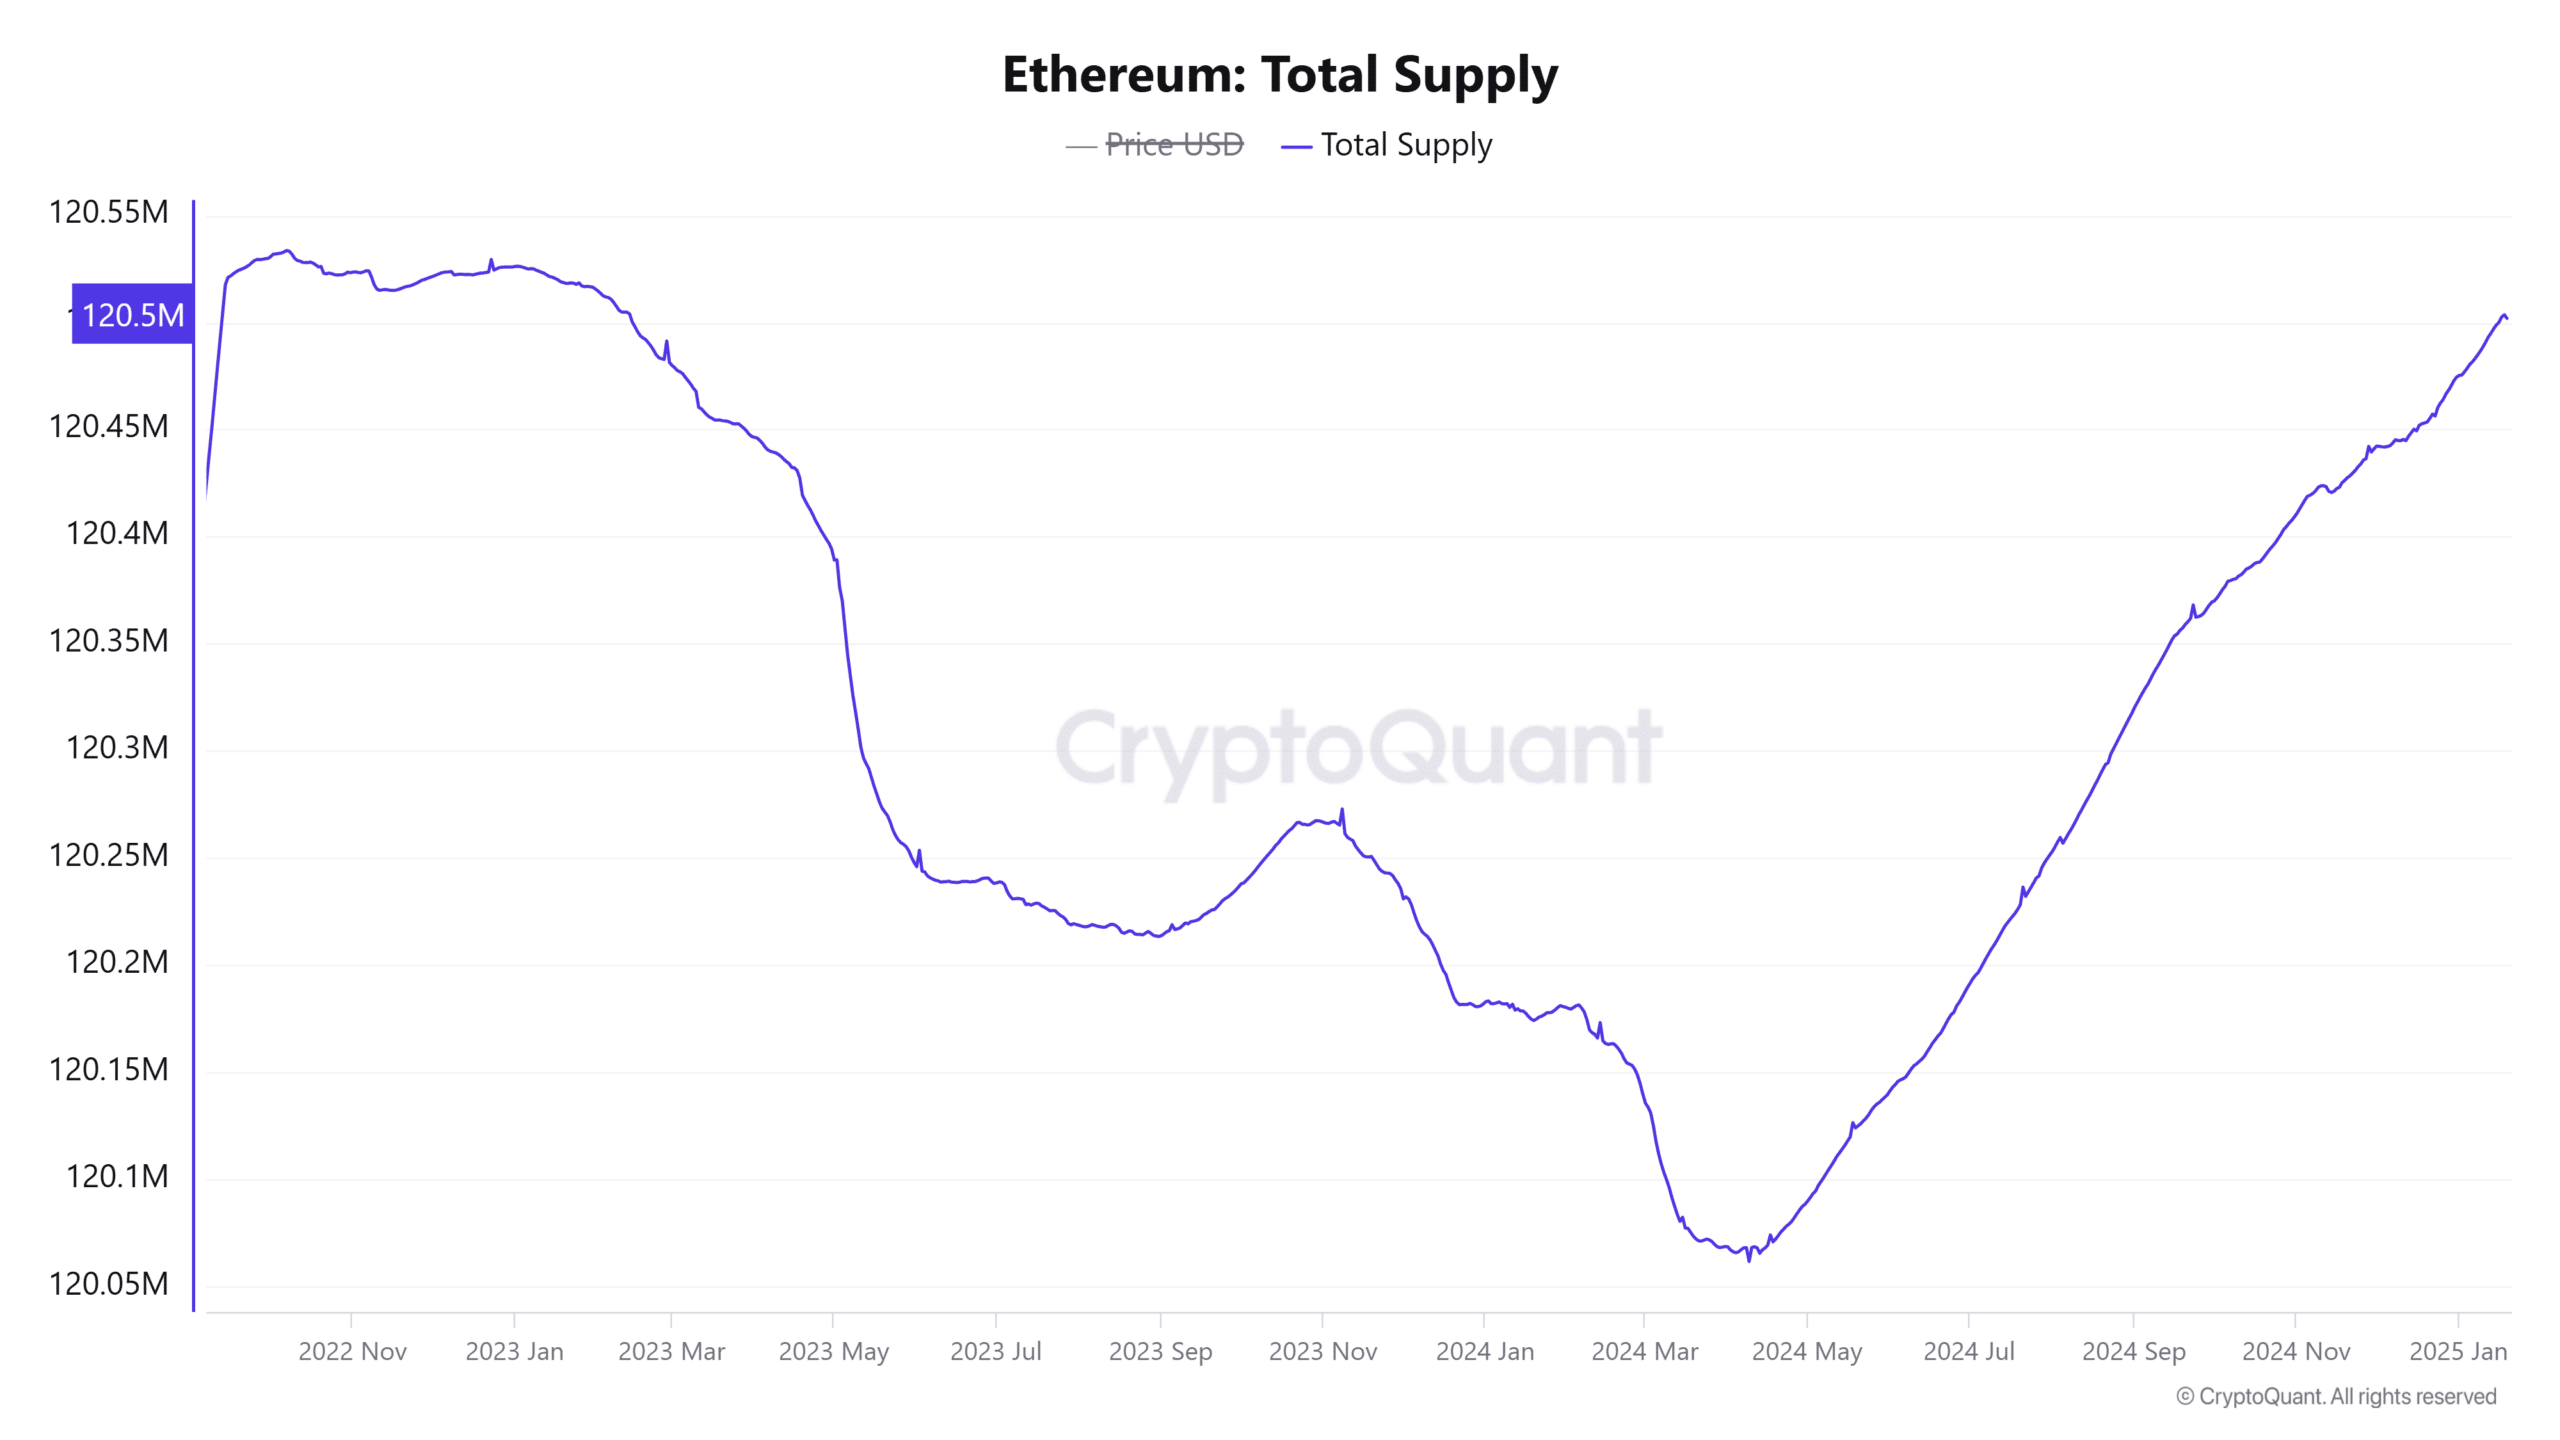
- Ethereum’s supply has surged to 120,501,906, and it is currently approaching its highest level in nearly two years.
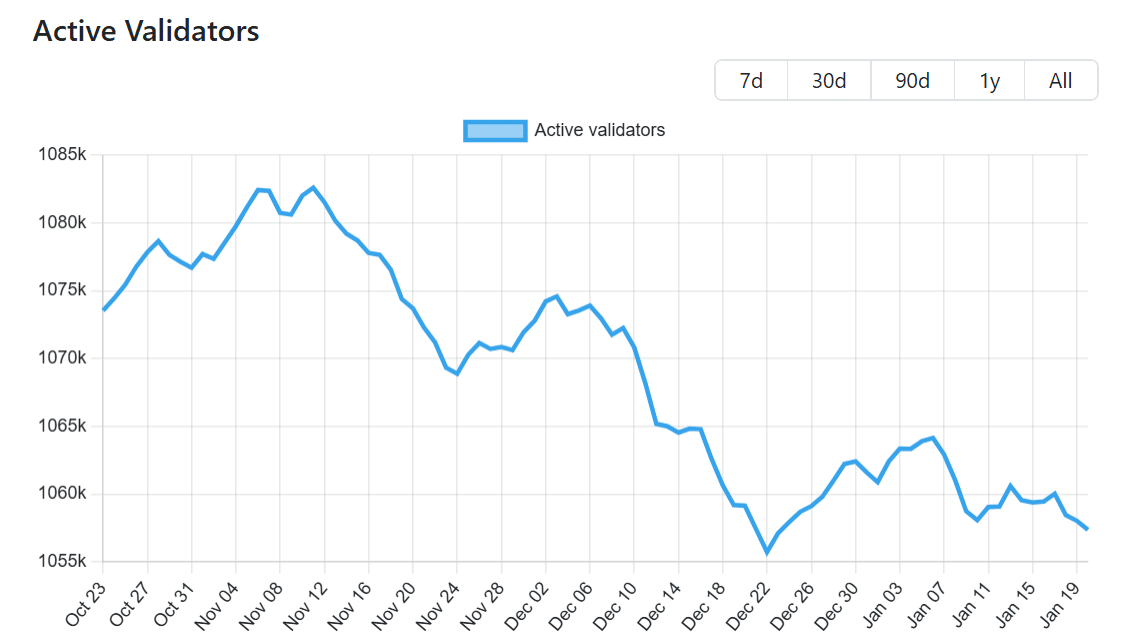
- The number of validators on the network has also dropped by around 2% in the last three months.
Ethereum’s [ETH] has recorded a significant increase in its total supply, which is approaching its highest level in nearly four years.
The rising supply is hindering Ethereum’s potential for gains given that in recent months, it has underperformed against Bitcoin [BTC] and other top altcoins.
ETH supply nears two-year high
CryptoQuant data shows that ETH’s supply currently stands at 120,501,906, which is its highest level since February 2023.
If this rise continues, it could soon reach the level it was before the Ethereum Merge.

Source: CryptoQuant
The Merge, an event that switched Ethereum from Proof-of-Work (PoW) to Proof-of-Stake (PoS), was meant to make ETH deflationary. It reduced ETH issuance from around 13,000 ETH per day to 1,700 ETH per day depending on staking activity.
However, Ultrasound Money shows that in just thirty days, ETH’s supply has increased by 45,724 ETH. When the supply rises amid weak demand, it could lead to bearish moves.
Dropping validator count suggests…
Ethereum’s PoS system relies on validators, who are required to stake ETH as collateral to validate transactions.
However, in the last three months, the validator count on the network has dropped by around 2% to 1,057,356.


Source: Validator Queue
This decline suggests that there is a surge in unstaking activity, which is contributing to the rising supply. Per Validator Queue, the amount of staked ETH is currently equivalent to 27% of Ethereum’s circulating supply.
Declining activity on the Ethereum mainnet
Besides the weakened demand for ETH staking, reduced activity on the Ethereum mainnet could be contributing to the rising supply. Each transaction on Ethereum has a base fee paid in ETH that is later burned.
This burning process is meant to make ETH deflationary. However, when there is reduced activity on the mainnet, it results in fewer tokens being burned, causing the supply to increase.
Per L2Beat data, most activity has been diverted from the Ethereum mainnet to layer two networks. For instance, the 30-day count for transactions on Base stands at 312M, which is nearly ten times higher than Ethereum’s 36M.
As more people rely on Ethereum layer two networks and not the mainnet, it could suppress the burn process, which will impact the amount of ETH being taken out of circulation.
ETH/BTC hits lowest level since 2021
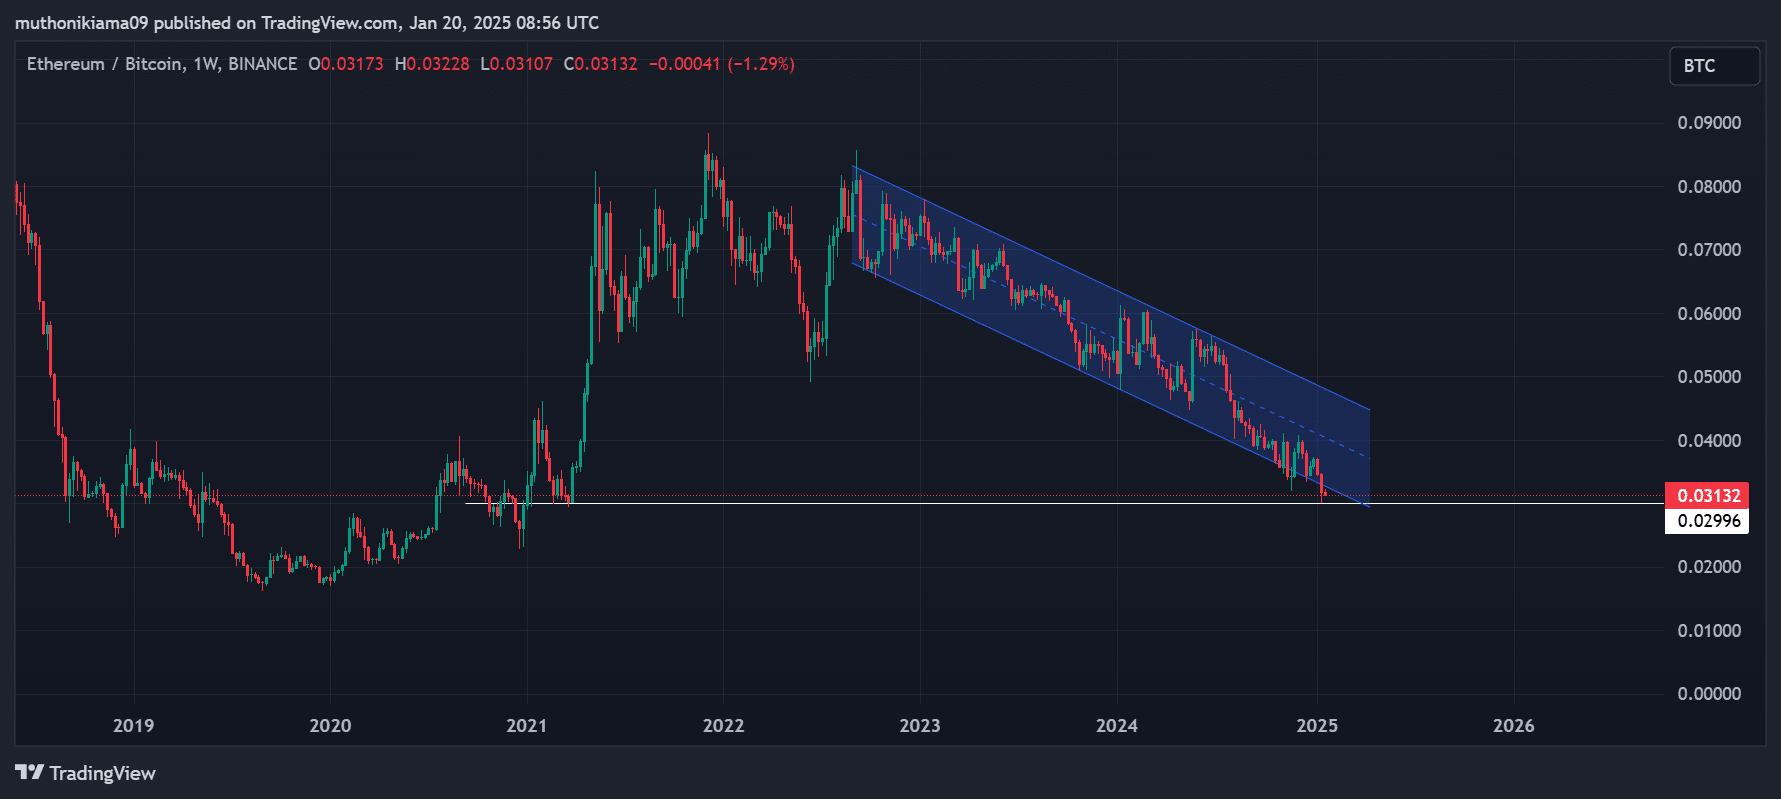
As Ethereum’s supply dynamics weigh on the price, Bitcoin has continued to outperform the altcoin. ETH/BTC has dropped to 0.02996, marking its lowest level since March 2021.


Source: TradingView
Read Ethereum’s [ETH] Price Prediction 2025–2026
ETH/BTC has been trading within a descending parallel channel on its weekly chart.
Following the recent dip, it has breached the lower trendline of the channel, confirming that Ethereum was in a downtrend and could record new lows.

