
- This new regression channel, established on the 4-hour timeframe, could propel APT towards $7.5.
- The market emitted mixed signals, providing positive, neutral, and negative forecasts for the near term.
Aptos [APT] has recently navigated a tough market cycle and suffered a 6.63% decline. Upon reaching the support level of its current regression channel, it achieved a 3.95% increase over the last 24 hours.
While the outlook for APT leans towards bullish, there is an underlying bearish sentiment, which requires a careful analysis of both trends.
Major bullish confirmation
Between April and August, APT has been trading within a regression channel pattern.
This pattern is characterized by downward diagonal movement between two defined levels—the upper and lower lines—which act as supply and demand zones.
The pattern is generally bullish, and it’s confirmed by a breach of the channel’s upper line. Recently, APT broke above the daily regression channel, suggesting increasing buying pressure.
However, it is now contained within another regression channel on the 4-hour timeframe.
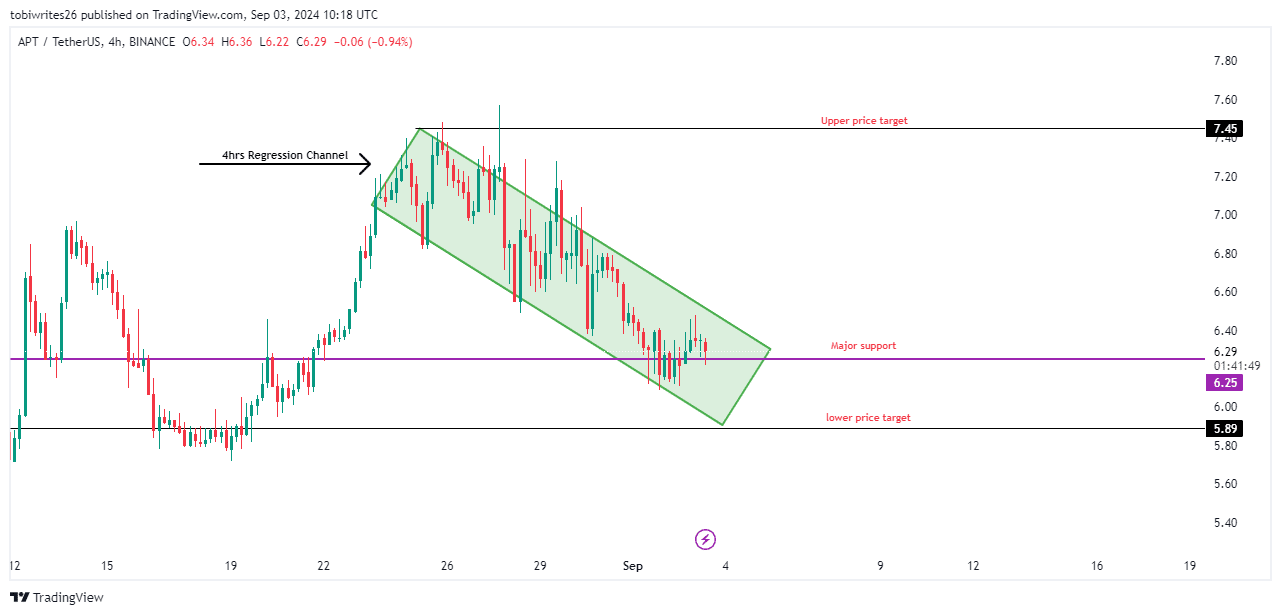
Source: TradingView
Such a move strengthens the bullish confirmation.
At press time, APT was trading at the bottom of this regression channel, which aligned with another major support level at $6.25. This alignment indicated strong buying pressure.
This buying interest is likely to drive APT’s price to the top of the channel at $7.45, which served as the near-term target. Looking ahead, a long-term target is projected in the $10 range.
Trader interest remains high
According to a liquidation chart from Coinglass, AMBCrypto reported that within the past 24 hours, traders anticipated a decline in APT faced significant liquidations.
Specifically, of the $199.59k total liquidated, shorts contributed $143.80k, compared to $55.79k from longs, indicating a bullish market sentiment.
This trend suggested increasing confidence in APT’s potential upward movement, potentially boosting its market price.
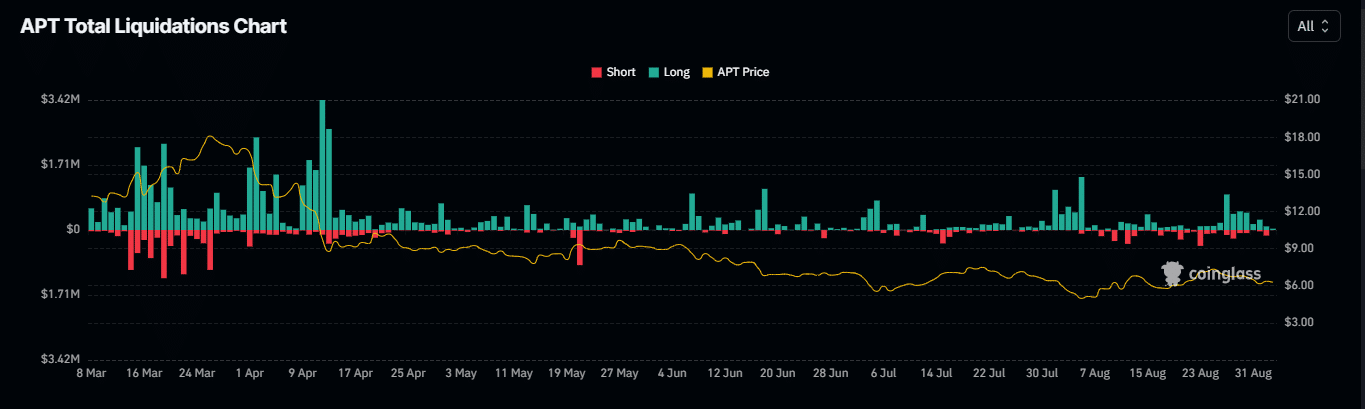
Source: Coinglass
Additionally, the Relative Strength Index (RSI)—a momentum oscillator that identifies overbought (above 70) and oversold (below 30) conditions—positioned APT in the neutral zone with a score of 48.73.
Notably, the RSI was trending upward, nearing the upper end of neutrality. Historical patterns indicated that if the RSI crosses into bullish territory —above 50 — APT’s price is likely to ascend in response.
The bears are still in proximity
According to NetFlow data from Coinglass, the presence of bears remains evident. NetFlow is calculated by subtracting the inflow of an asset from its outflow on exchanges.
Typically, a negative flow indicates a bullish market, as it reduces the asset’s supply on exchanges.
However, the situation is reversed for APT; it has consistently shown a positive NetFlow, indicating an increased deposit of APT on exchanges which boosts supply and the potential for selling.
Currently, the NetFlow for APT stood at $1.59 million over the last 24 hours, a trend that has persisted over the past week.
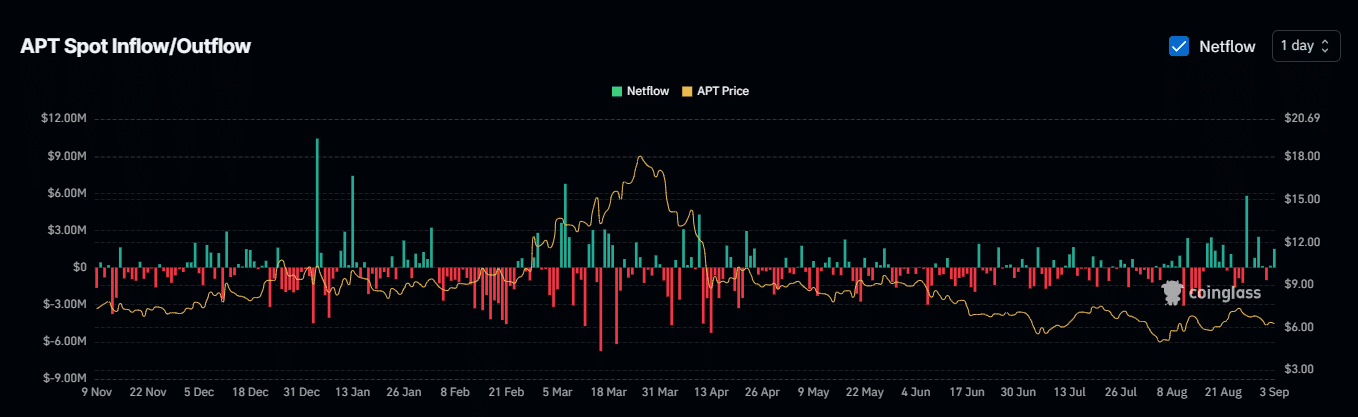
Source: Coinglass
Read Aptos’ [APT] Price Prediction 2024–2025
Additionally, Open Interest has been on a decline since the beginning of September. A decrease in Open Interest suggests lingering bearish sentiment.
If short traders dominate, APT could potentially drop to as low as $5.89, as marked on the accompanying chart above.