- RENDER’s bearish sentiment has grown noticeably, with an increasing number of sellers causing downward pressure.
- This has added to the asset’s struggles as it encounters multiple resistance levels, making further declines likely.
Render [RENDER] was among the market’s top performers last month—surging by 45.28%—but its momentum has since faltered. After failing to break through key resistance points, the asset has dropped by 10.01% in the last 24 hours, raising concerns about its near-term trajectory.
Unless RENDER regains the interest of market participants, its current slide could continue, leaving its recovery prospects uncertain.
RENDER price under pressure
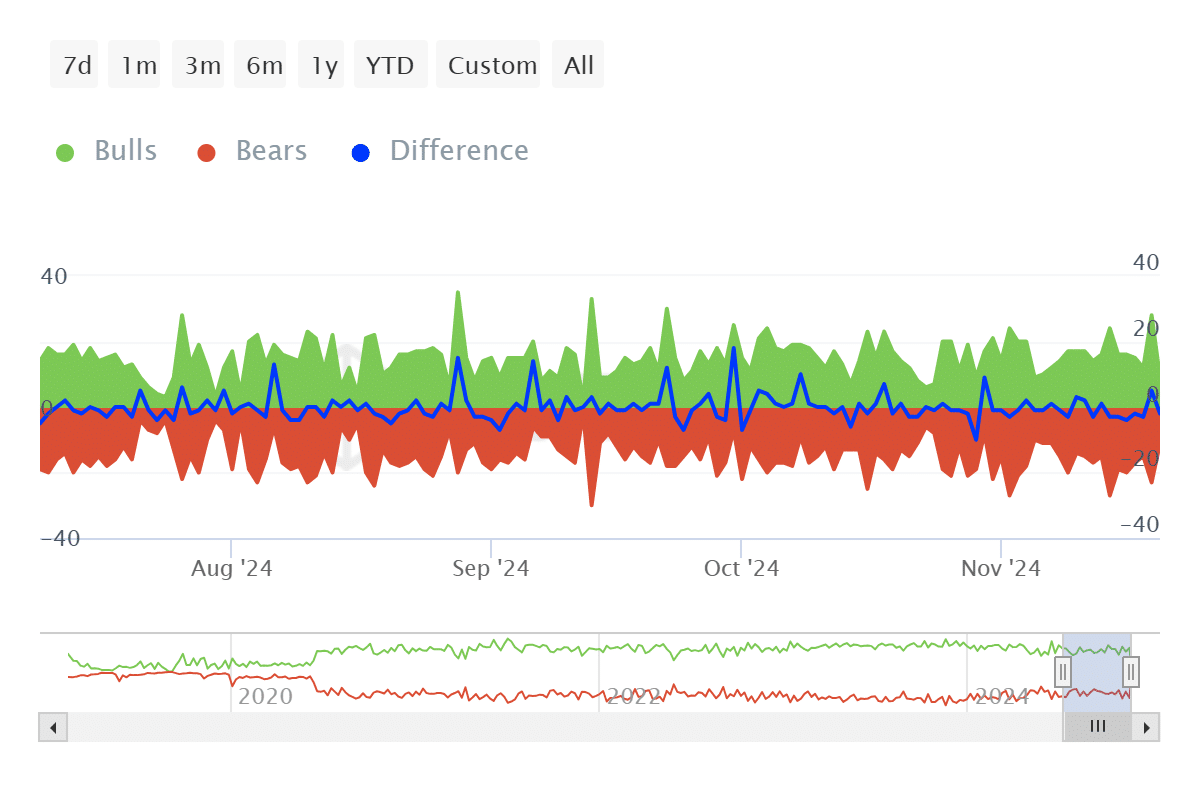
The bears have firmly seized control of the RENDER market, outnumbering the bulls and exerting significant downward pressure. According to IntoTheBlock, 132 Bear addresses were active over the past seven days, compared to just 120 bull ones.
In this context, bulls and bears are defined as addresses responsible for buying or selling at least 1% of the total trading volume. This current disparity highlights the growing influence of bearish participants.
Source: IntoTheBlock
Adding to the pessimism, the Active Address Ratio—measuring active addresses relative to those holding a balance—has fallen to 1.09%. Such a decline is typically a strong indicator of negative market sentiment.

Source: IntoTheBlock
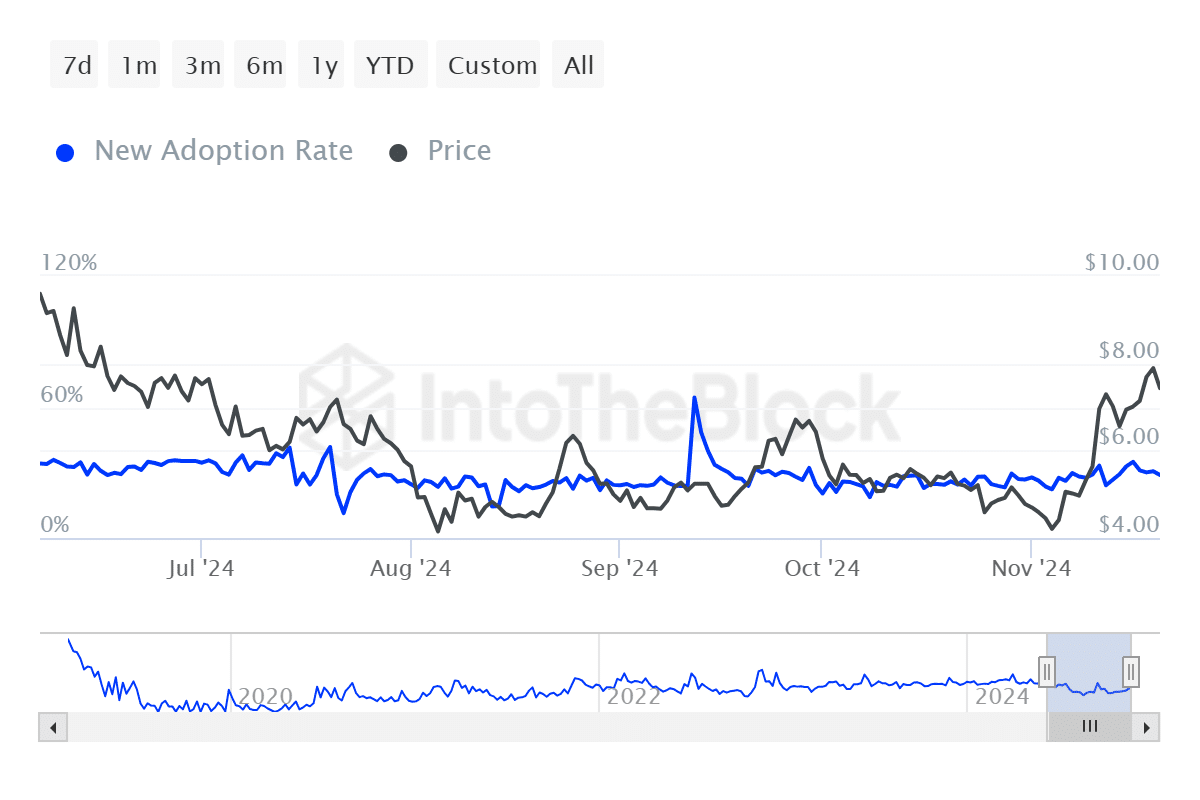
Meanwhile, RENDER’s New Adoption Rate, which tracks first-time transactions involving the asset, has dropped to 28.82% as of press time. This decline reflects declining interest in the asset and signals potential challenges ahead for its recovery.
Resistance levels weigh on RENDER
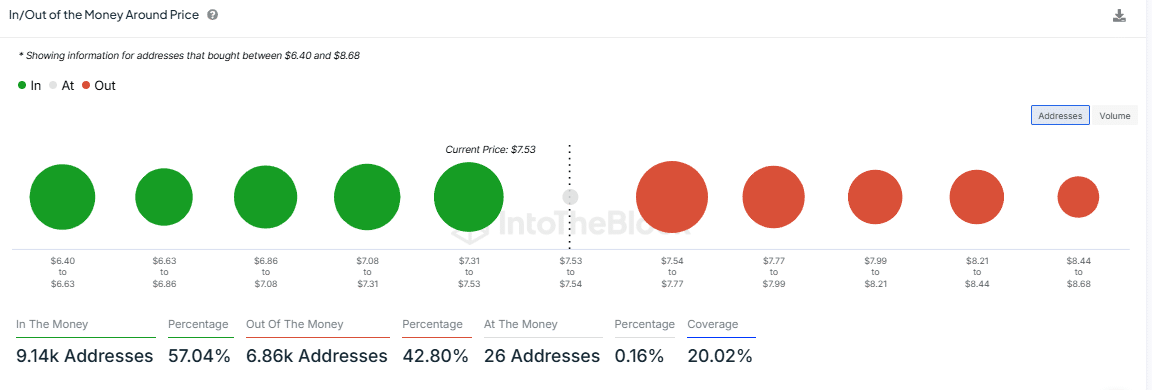
RENDER has encountered a significant resistance zone, as highlighted by the “In/Out of the Money Around Price” (IOMAP) metric. This tool identifies key support and resistance levels, revealing catalysts and obstacles that could hinder price momentum.
Data from IntoTheBlock shows that the previous day’s high of 8.211 aligns with an IOMAP resistance range between 7.99 and 8.21. This zone is reinforced by a sell order of 3.28 million RENDER tokens, intensifying bearish pressure.

Source: IntoTheBlock
Technical analysis further reflects the challenges for RENDER. The token has simultaneously hit two critical resistance points: a descending trendline and a horizontal resistance level at 7.97, both of which correspond with the IOMAP resistance range.
Is your portfolio green? Check the Render Profit Calculator
These overlapping barriers make a further decline increasingly likely.
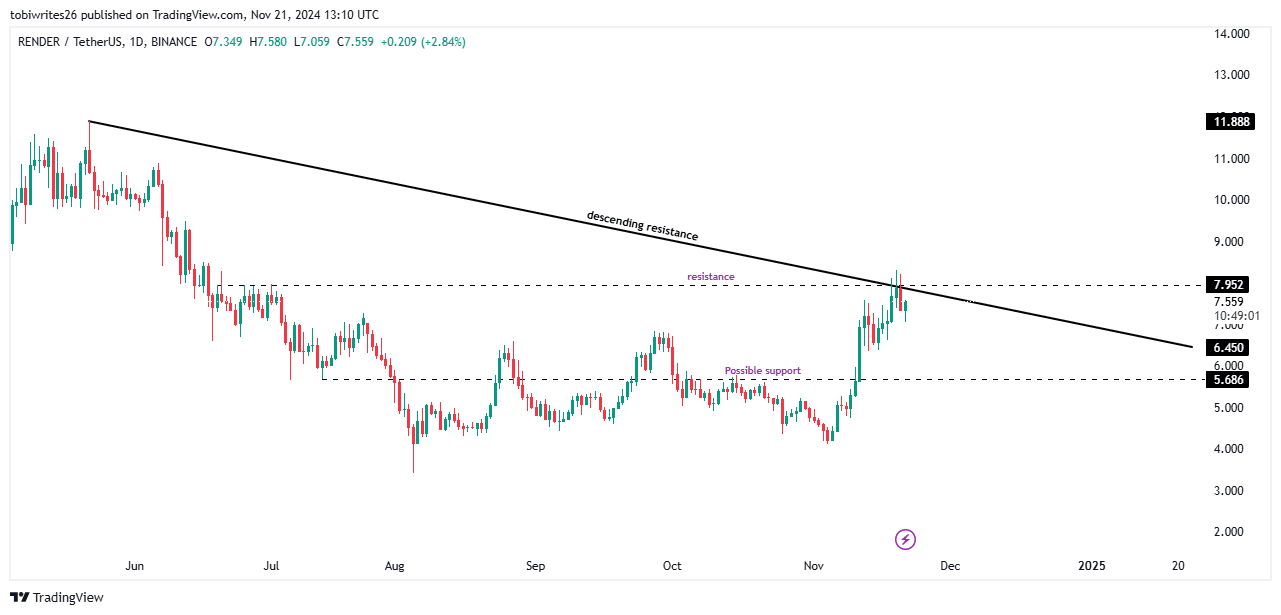

Source: Trading View
If selling momentum persists, RENDER could fall to its next major support level, which sits at 5.686.

