- BNB liquidations cause instant local reversal.
- Price action and key indicators point a correction might be on the horizon.
Binance Coin [BNB], the fourth-largest coin by market cap, has recently gained attention following the release of former Binance CEO, CZ, who was detained for four months due to U.S. money laundering allegations.
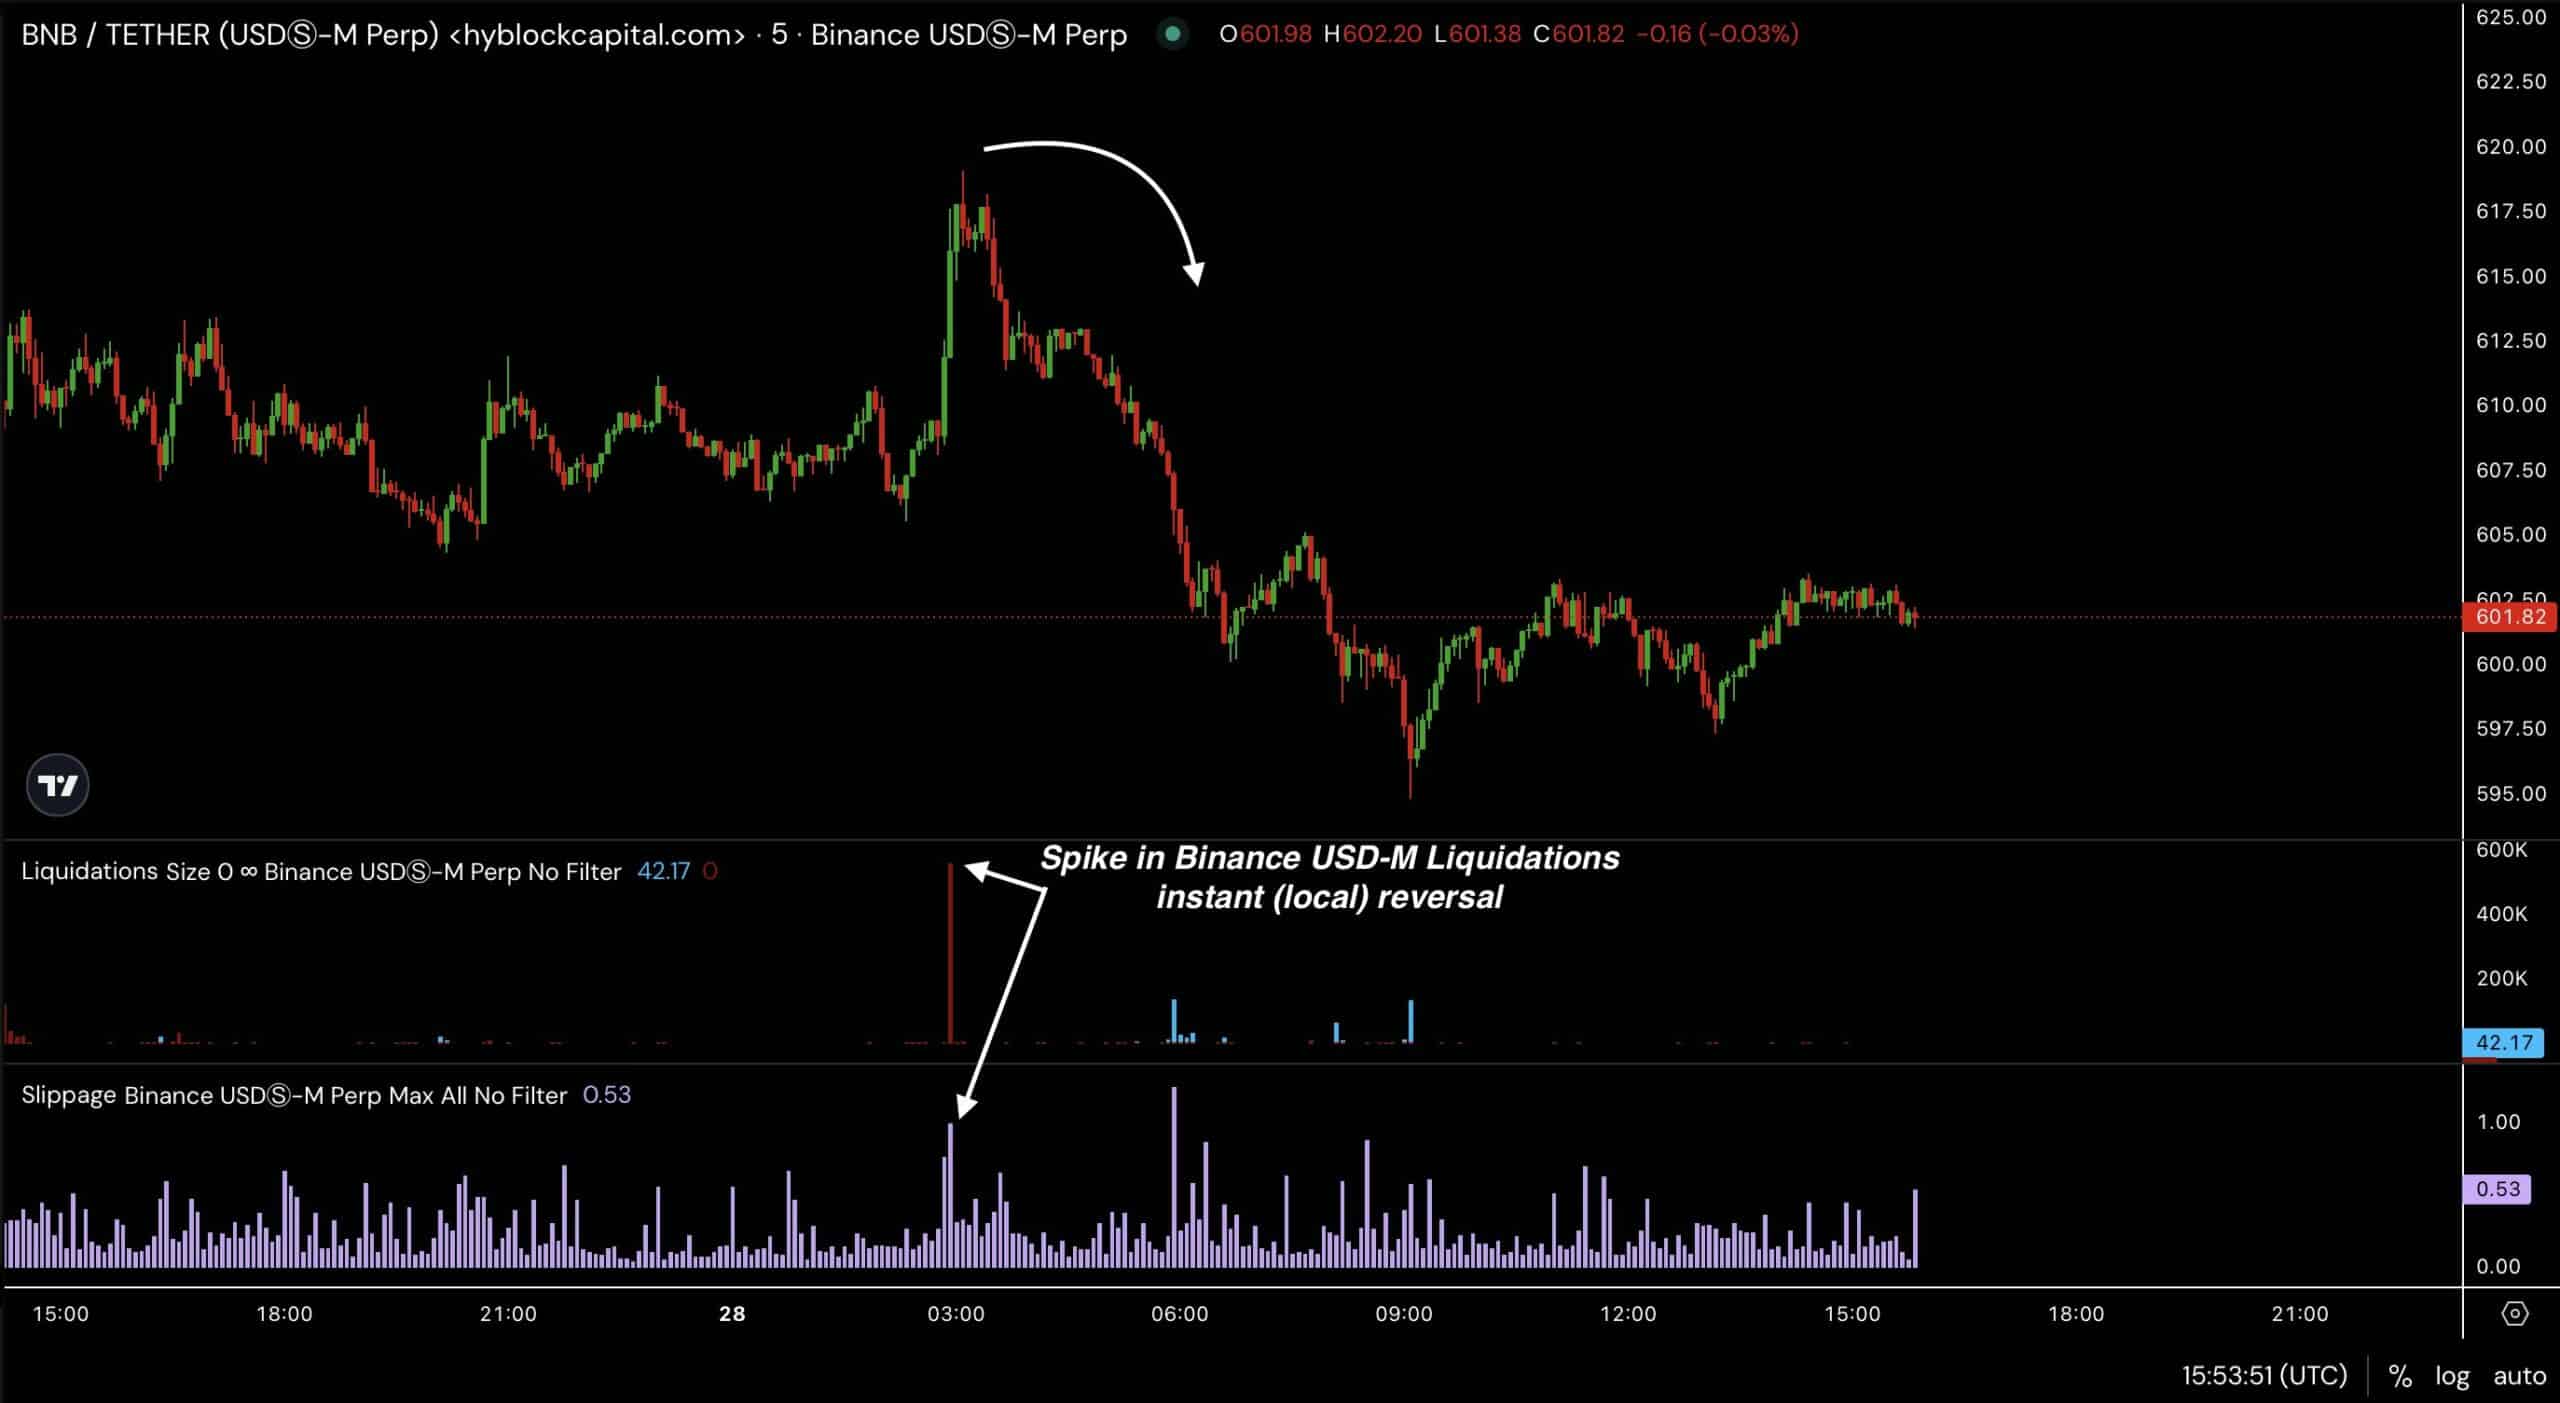
His release sparked market movement in BNB. The surge in Binance was followed with a spike in liquidations that caused an instant local reversal most BNB pairs.
This raises the question of whether BNB will undergo a correction before climbing higher in Q4, a period typically bullish for crypto markets.

Source: Hyblock Capital
A closer look at the BNB/USDT pair could provide some insights into the potential price direction.
BNB been in an uptrend for 3 weeks
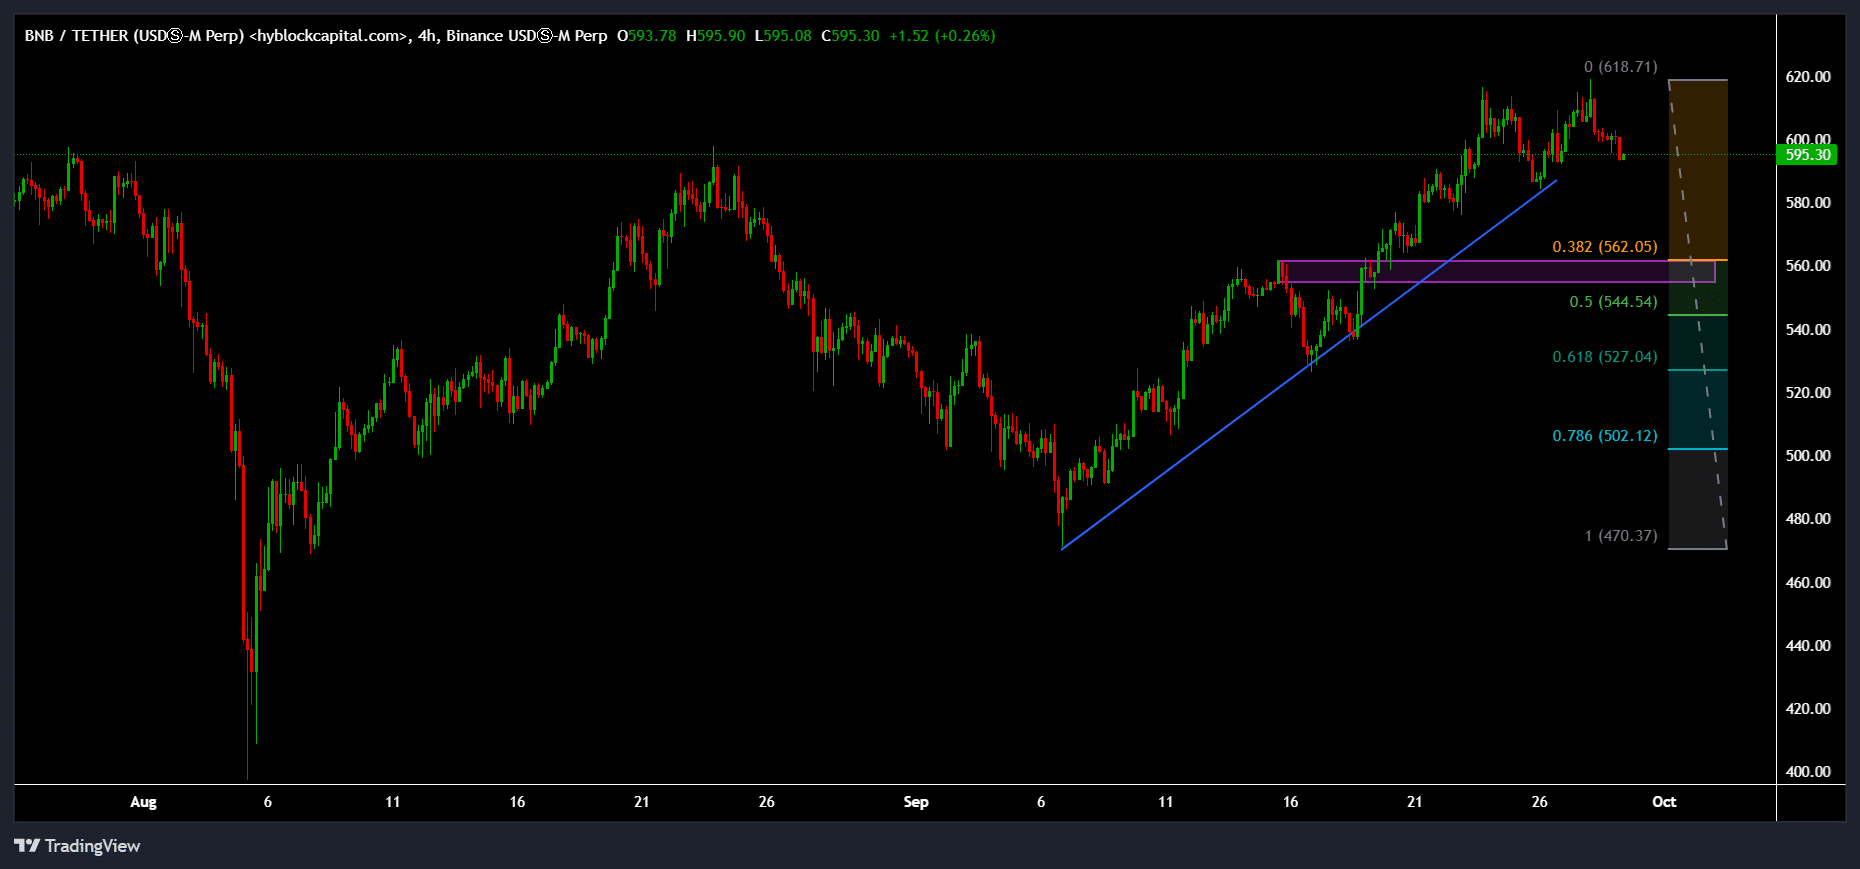
BNB/USDT has been in a solid uptrend, with consistent higher highs and higher lows over the last three weeks. This trend is evident on the 4-hour chart, which provides a balanced view of both short-term and long-term price movements.
Recently, BNB hit the $620 level, signaling a potential pause in the uptrend and a possible correction. The formation of a double top at the $620 mark suggests a possible retracement, which could be confirmed if the price breaks below the double top’s neckline.


Source: Hyblock Capital
Should this break occur, BNB might correct down to the $560 level, or even as low as $540, which represents the equilibrium of the 4-hour price movement over the last three weeks.
The $560 price level coincides with the 0.382 Fibonacci Retracement level, which often acts as support during healthy trends like this one.
Given the overall bullish outlook for the crypto market in Q4, a retracement to $560 could present an ideal buying opportunity, with the potential for BNB to climb to $800, yielding a 40% return on investment.
Net longs, shorts delta & open interests
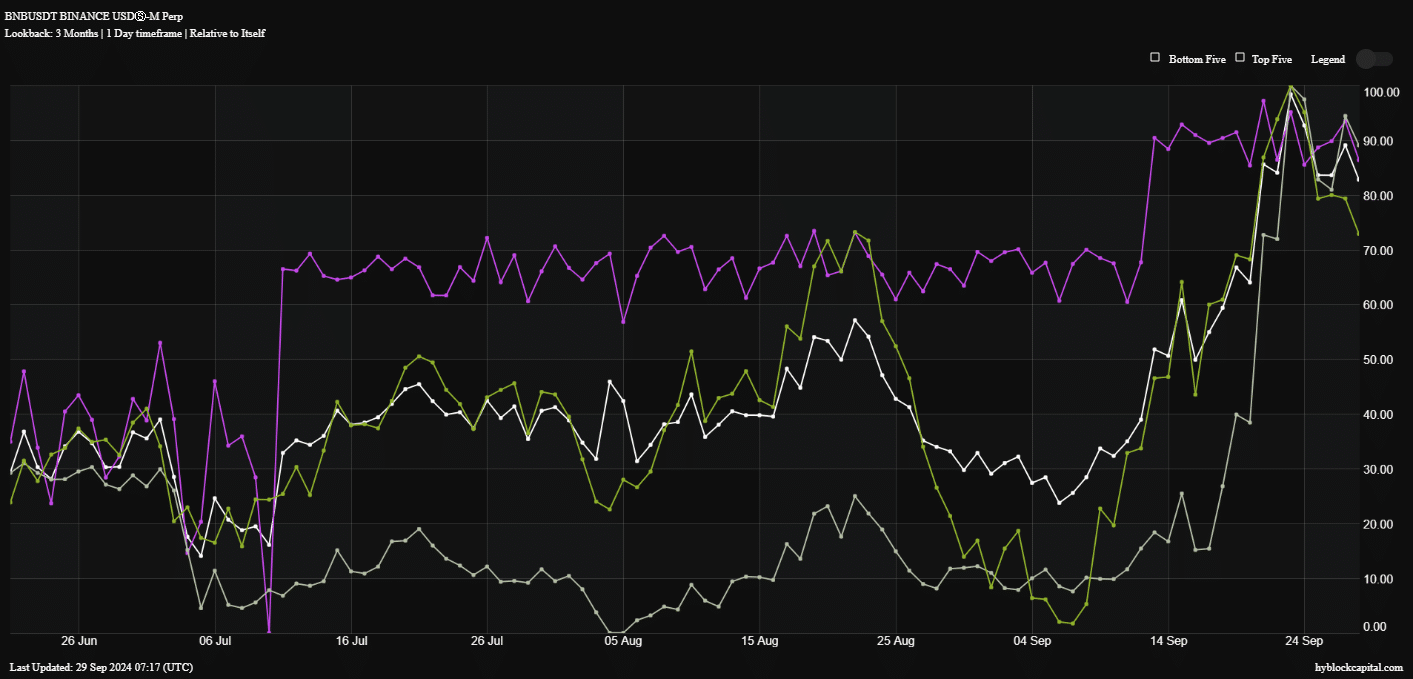
In addition to BNB price action, other metrics such as net longs shorts delta, open interest, and whale vs retail delta suggest a potential correction. These indicators, which reached peak levels at 100%, have recently dipped, with the global average now around 82%.
The net longs shorts delta for BNB, which tracks the balance between buyers and sellers, has decreased from its peak and currently stands at 86%, indicating reduced buyer momentum.
Meanwhile, open interest has dropped to 89%, further supporting the possibility of a correction.


Source: Hyblock Capital
The whale vs retail delta, which tracks large holders’ buying versus retail traders, has seen a notable decline. Whale dominance over retail traders has dropped nearly 40% in the last three months.
This suggests that whales are becoming less active, which often signals an impending market pullback. BNB’s recent price movements and market metrics indicate that a correction could happen soon.
However, a strong uptrend suggests the $560 level might present a good entry point for traders. From there, BNB has the potential to rise higher, possibly reaching $800.

