- Buying pressure was rising, which can help turn BTC’s charts green.
- A bullish trend reversal can push BTC towards $100k again.
After crossing $100,000 a few days ago, Bitcoin [BTC] has been witnessing multiple corrections. These pullbacks have once again pushed the king coin down to $97,000.
Meanwhile, a recent analysis suggested that BTC has a short-term support near $96k. Does this mean BTC will lose more value, or is it preparing a recovery rally to $100k?
Bitcoin is struggling
Bitcoin witnessed a more than 2.5% price decline in the past 24 hours, pushing it under the $97k mark. At the time of writing, the king coin was trading at $96,970.58 with a market capitalization of over $1.91 trillion.
Glassnode, a data analytics platform, posted a tweet highlighting a notable development.
The analysis used BTC’s Cost Basis Distribution (CBD) metric, which reveals where BTC’s supply has clustered at key price levels.
Recent data showed $99,559 as the largest accumulation zone below $100k (125k BTC), while $96k–$98k, with 120k BTC accumulated, shaped up as a potential support in the short term.

Source: X
In fact, AMBCrypto previously reported that BTC might drop to its support near $96k soon. This was the case as the king coin’s MVRV ratio reached a historic level, which on past occasions was followed by price corrections.
Can BTC recover anytime soon?
AMBCrypto then checked Bitcoin’s latest datasets to find out whether BTC will witness further price drops or if it shows signs of a recovery rally towards $100k again.
CryptoQuant’s data revealed that BTC’s aSORP was red. More investors are selling at a profit. In the middle of a bull market, it can indicate a market top.
Additionally, the king coin’s Binary CDD suggested that long-term holders’ movement in the last 7 days was higher than the average. If they were moved for the purpose of selling, it may have a negative impact.


Source: CryptoQuant
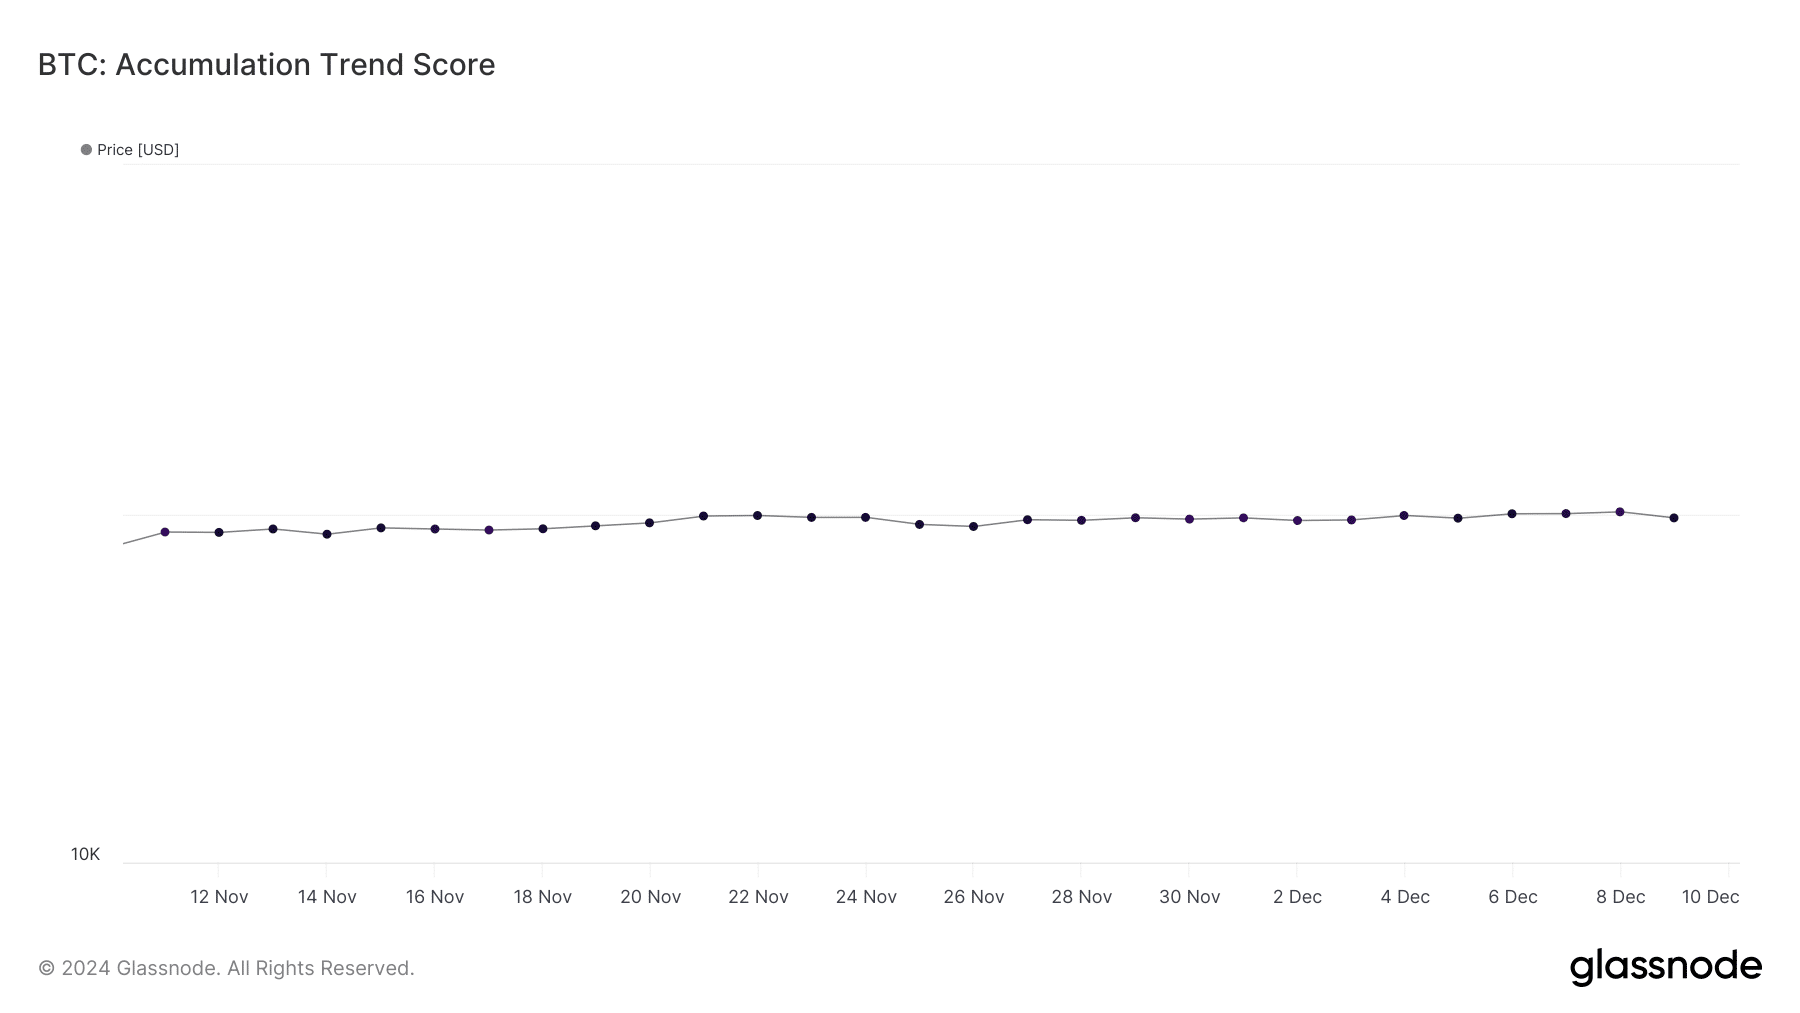
Nonetheless, BTC’s exchange reserve indicated that buying pressure increased in the last 24 hours as the metric was declining. Apart from this, BTC’s accumulation trend score had a value of 1.
For starters, a value closer to 1 is a sign of high accumulation, which shows investors’ confidence in the coin and can trigger a bullish trend reversal.


Source: Glassnode
Read Bitcoin’s [BTC] Price Prediction 2024-25
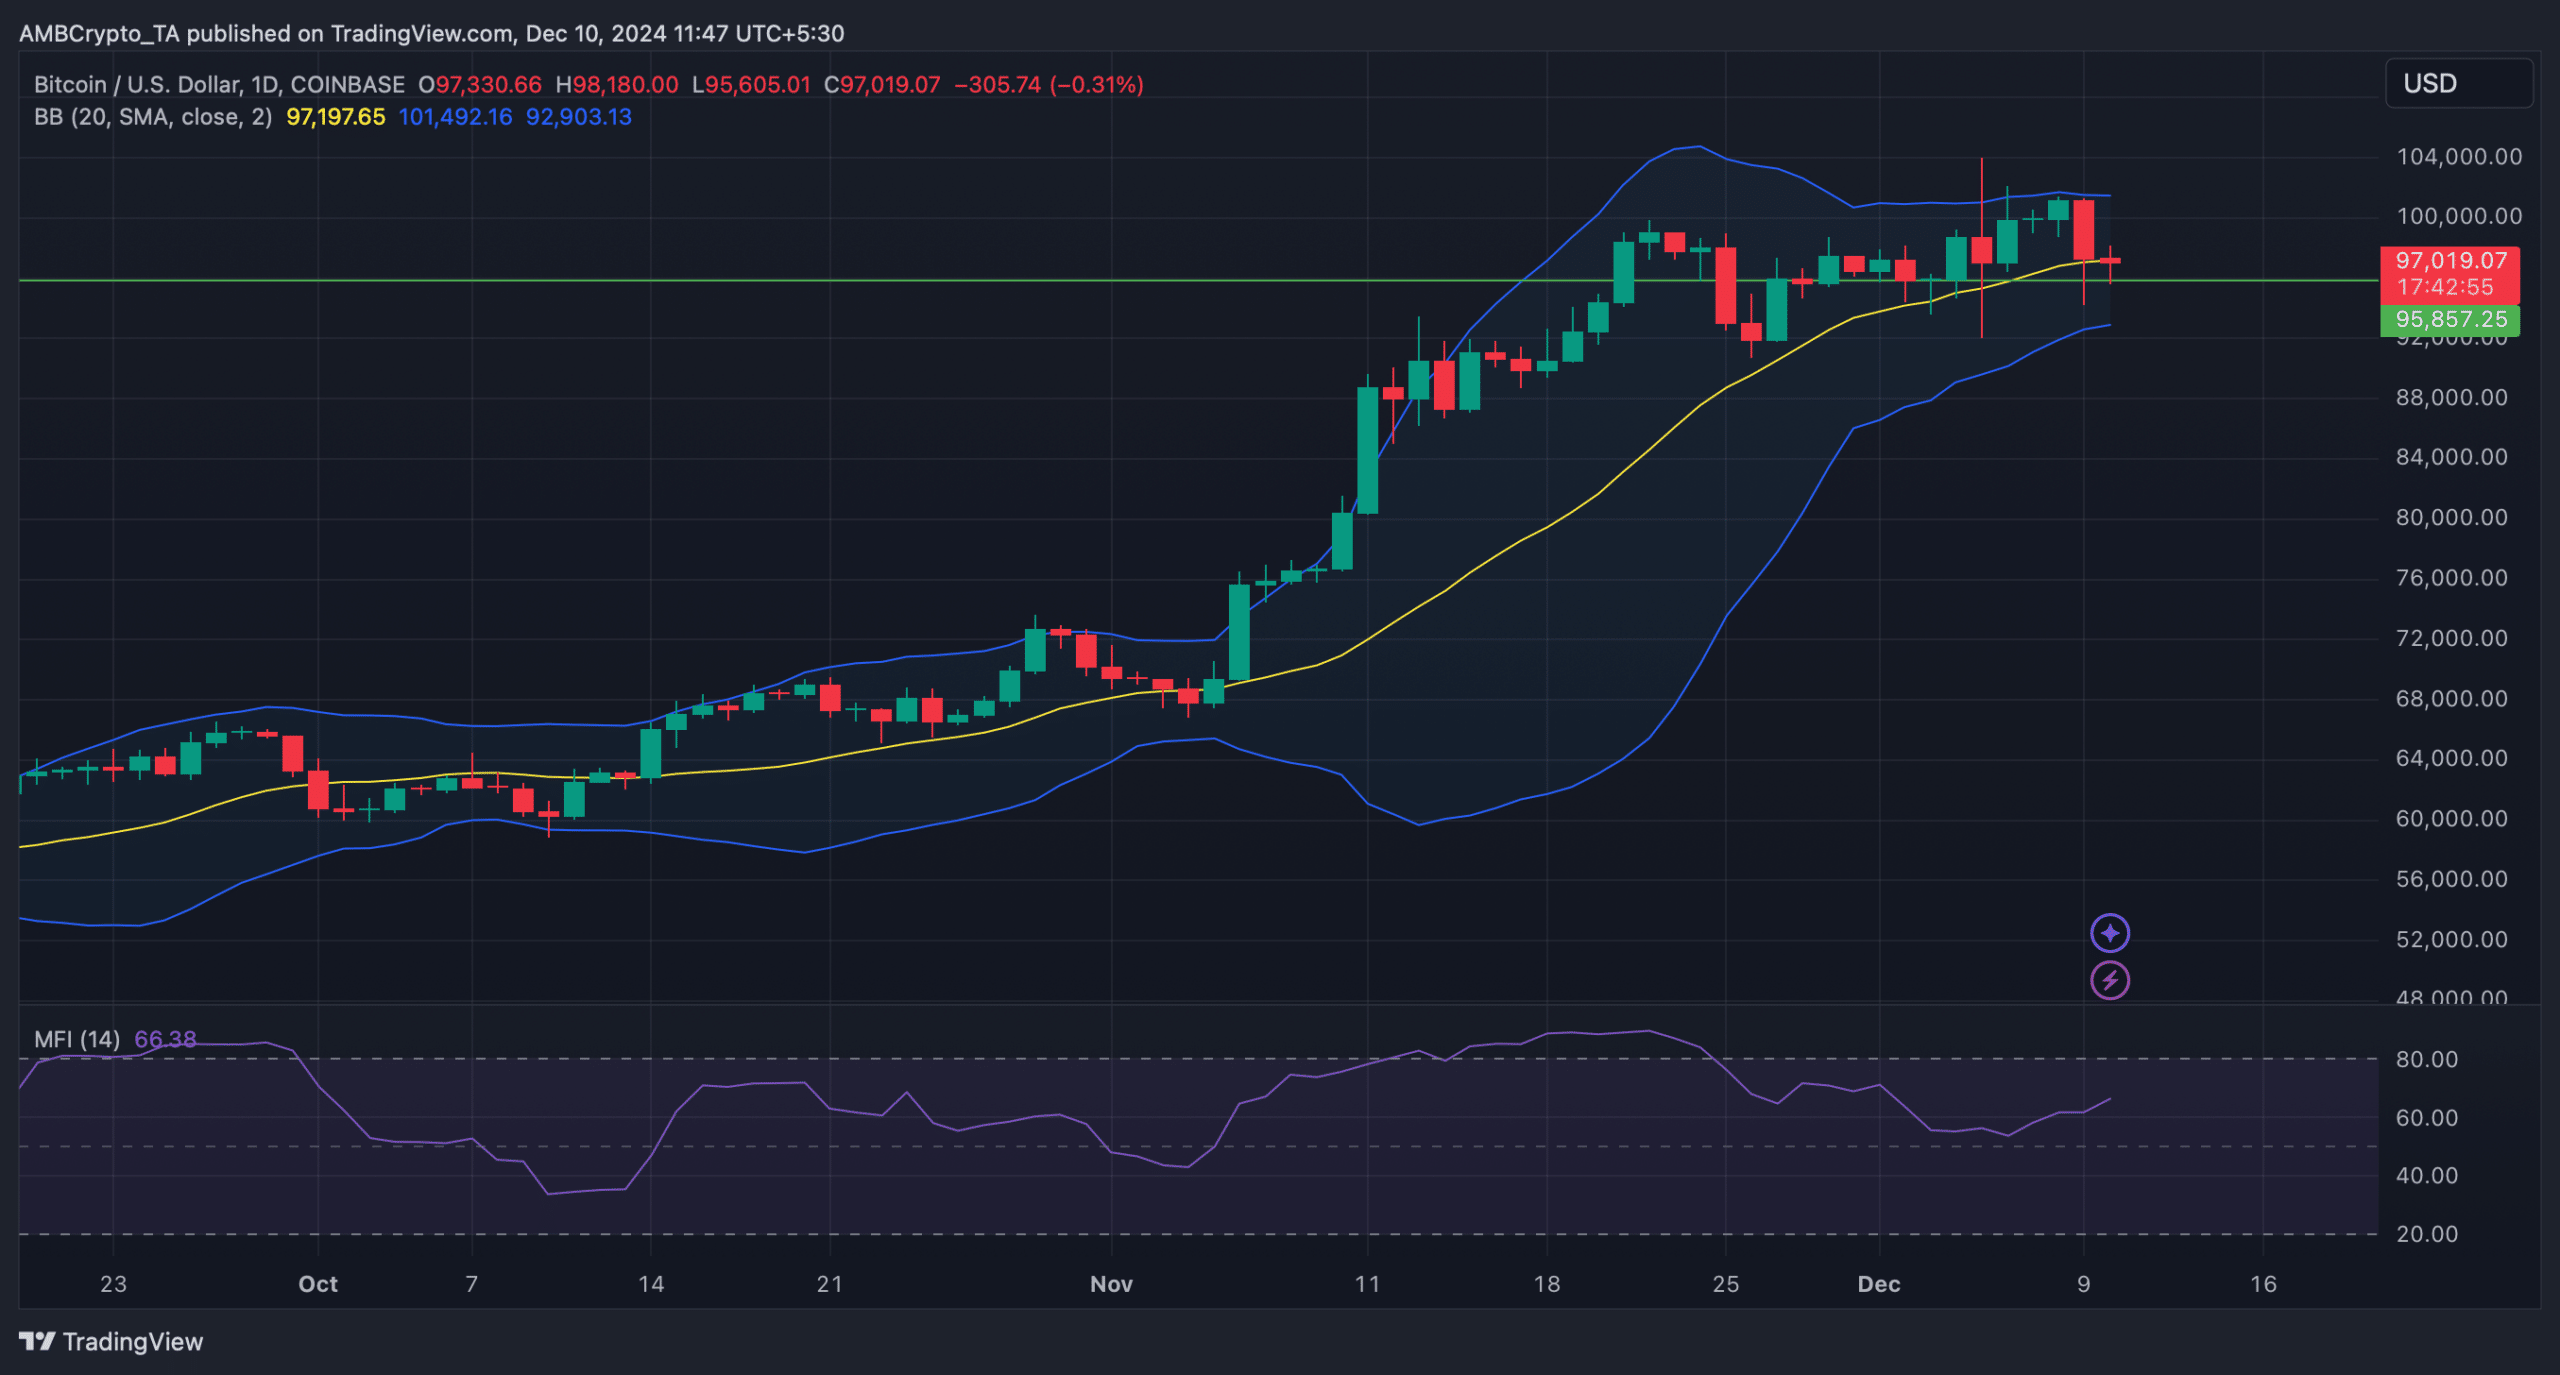
At the time of writing, BTC was testing its 20-day SMA support. A successful test could help BTC change the trend and move towards $100k again.
In fact, the Chaikin Money Flow (CMF) registered an uptick—a signal that BTC might manage to test the support. However, if selling pressure rises in the near term, then BTC might drop to $96k again.


Source: TradingView

