- One expert points to historical trends as a strong indicator of an impending BTC rally.
- Several key metrics support the potential for Bitcoin to climb higher, backed by multiple confluences in the data.
Last week, Bitcoin [BTC] faced considerable downward pressure, resulting in a 1.67% price drop. However, the market has since shown signs of recovery, with BTC gaining 1.30% in the last 24 hours.
Analysts expect these gains to continue, with historical data and multiple metrics suggesting Bitcoin could surpass its recent 15.27% rise and push higher in the coming weeks.
Historical data shows a 7% drop followed by a massive price surge
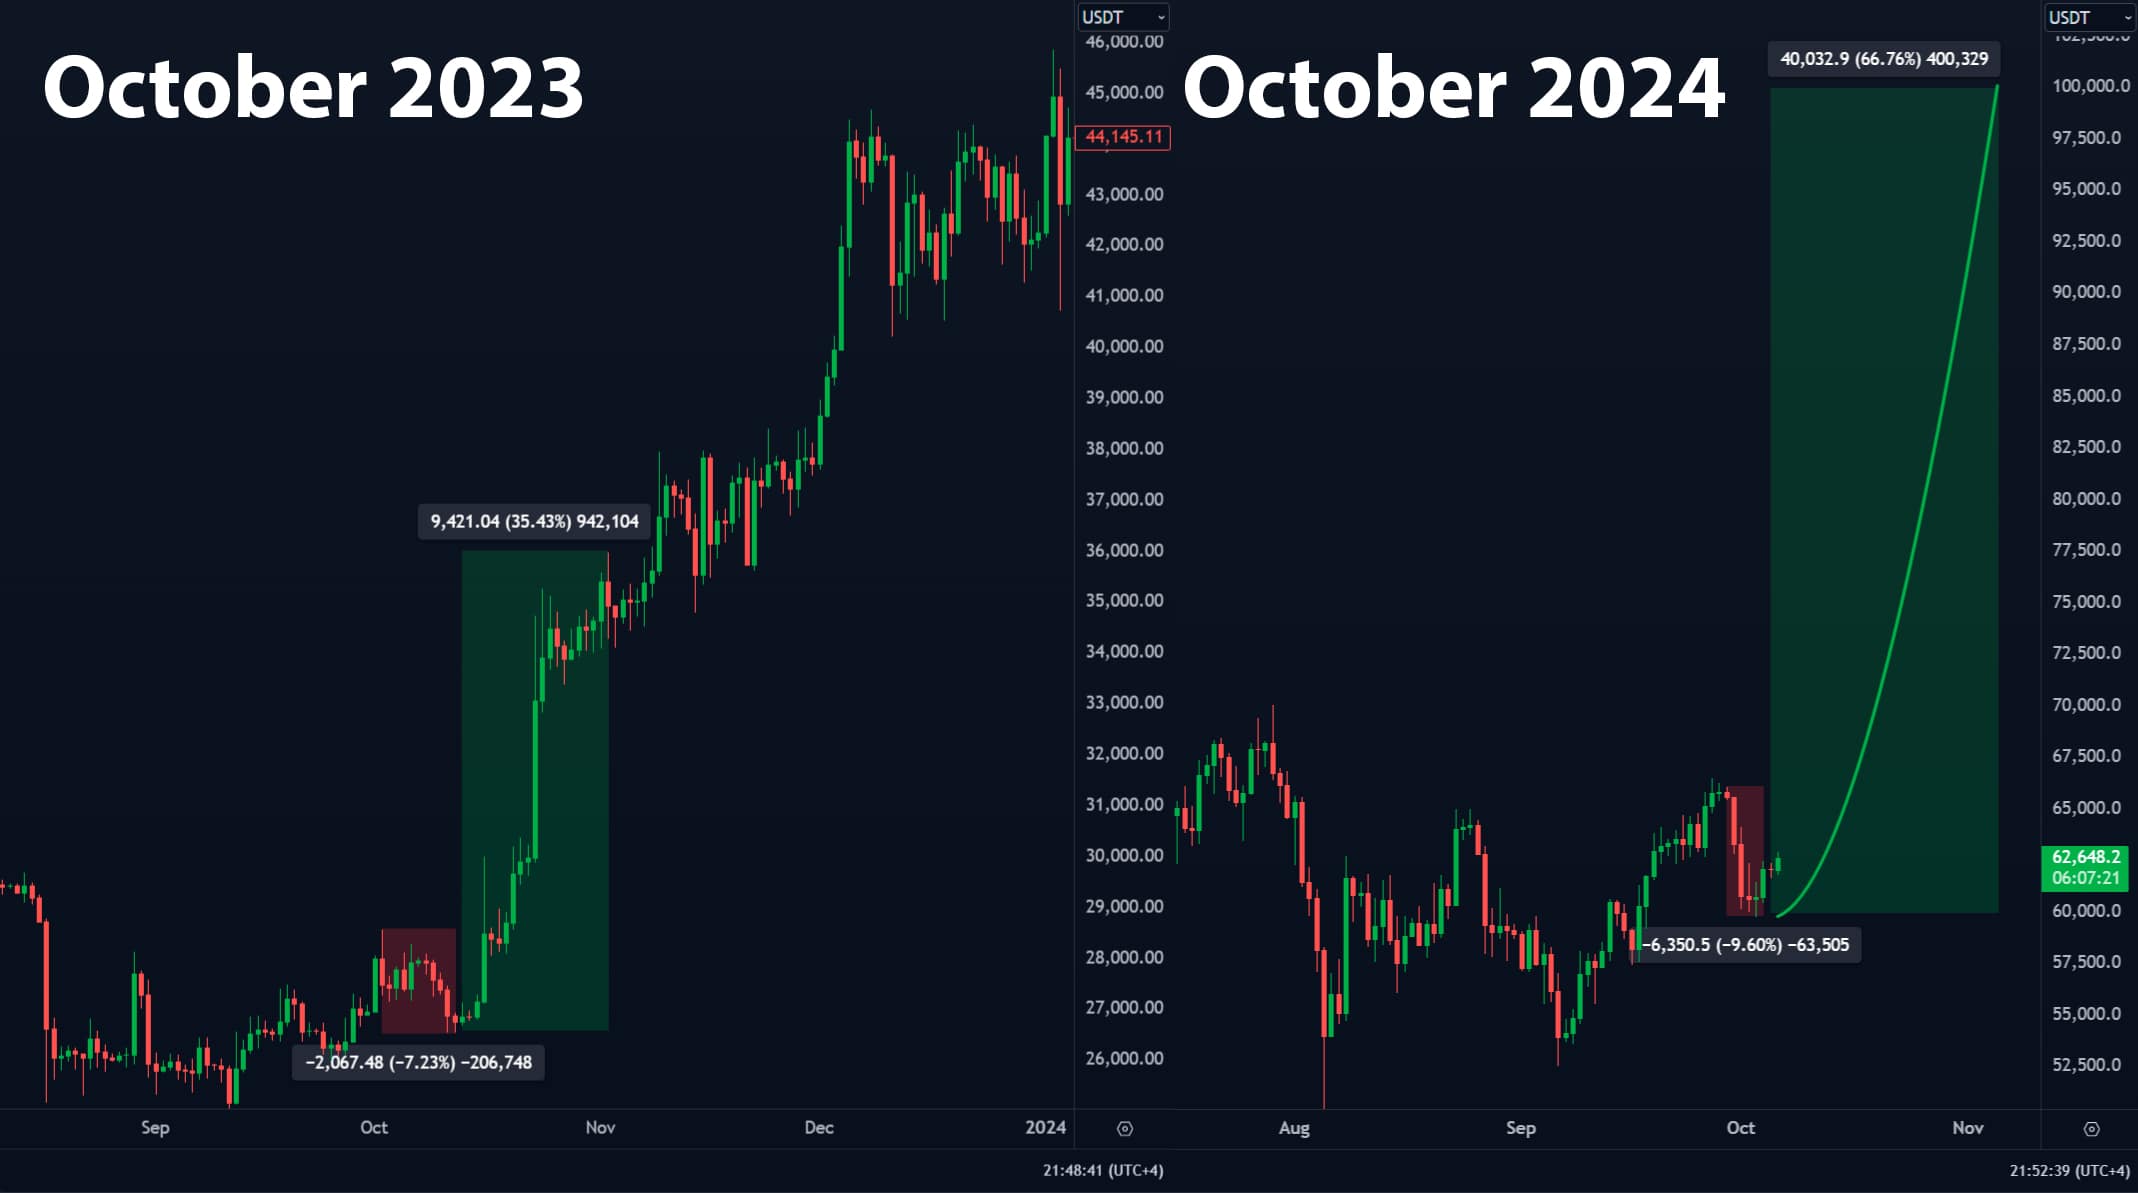
According to crypto analyst Carl Runefelt in a recent post on X (formerly Twitter), Bitcoin is currently at a historic crossroads similar to October 2023.
He noted:
“Bitcoin dropped 7% at the beginning of October 2023, and now it’s dropped about the same!”
Source: X
Based on the chart he shared, if this historical pattern repeats, BTC could rise by approximately 66.76%, potentially reaching $100,000. However, it’s worth noting that in 2023, the rally before consolidation only gained 35.43%.
Whether BTC will see a similar upward surge remains uncertain. AMBCrypto has analyzed various metrics to gauge market participants’ activities and provide insight into what might unfold in the upcoming trading sessions.
Traders exit exchanges, increasing demand for Bitcoin
At press time, the total supply of BTC across multiple crypto exchanges, as measured by the Exchange Reserve, has been in steady decline since 3rd October.
Currently, only 2.57 million BTC remain on exchanges, down from 2.58 million, indicating that traders are increasingly opting to store their Bitcoin off-exchange, signaling growing confidence in the asset. This shift is also driving higher demand for BTC.
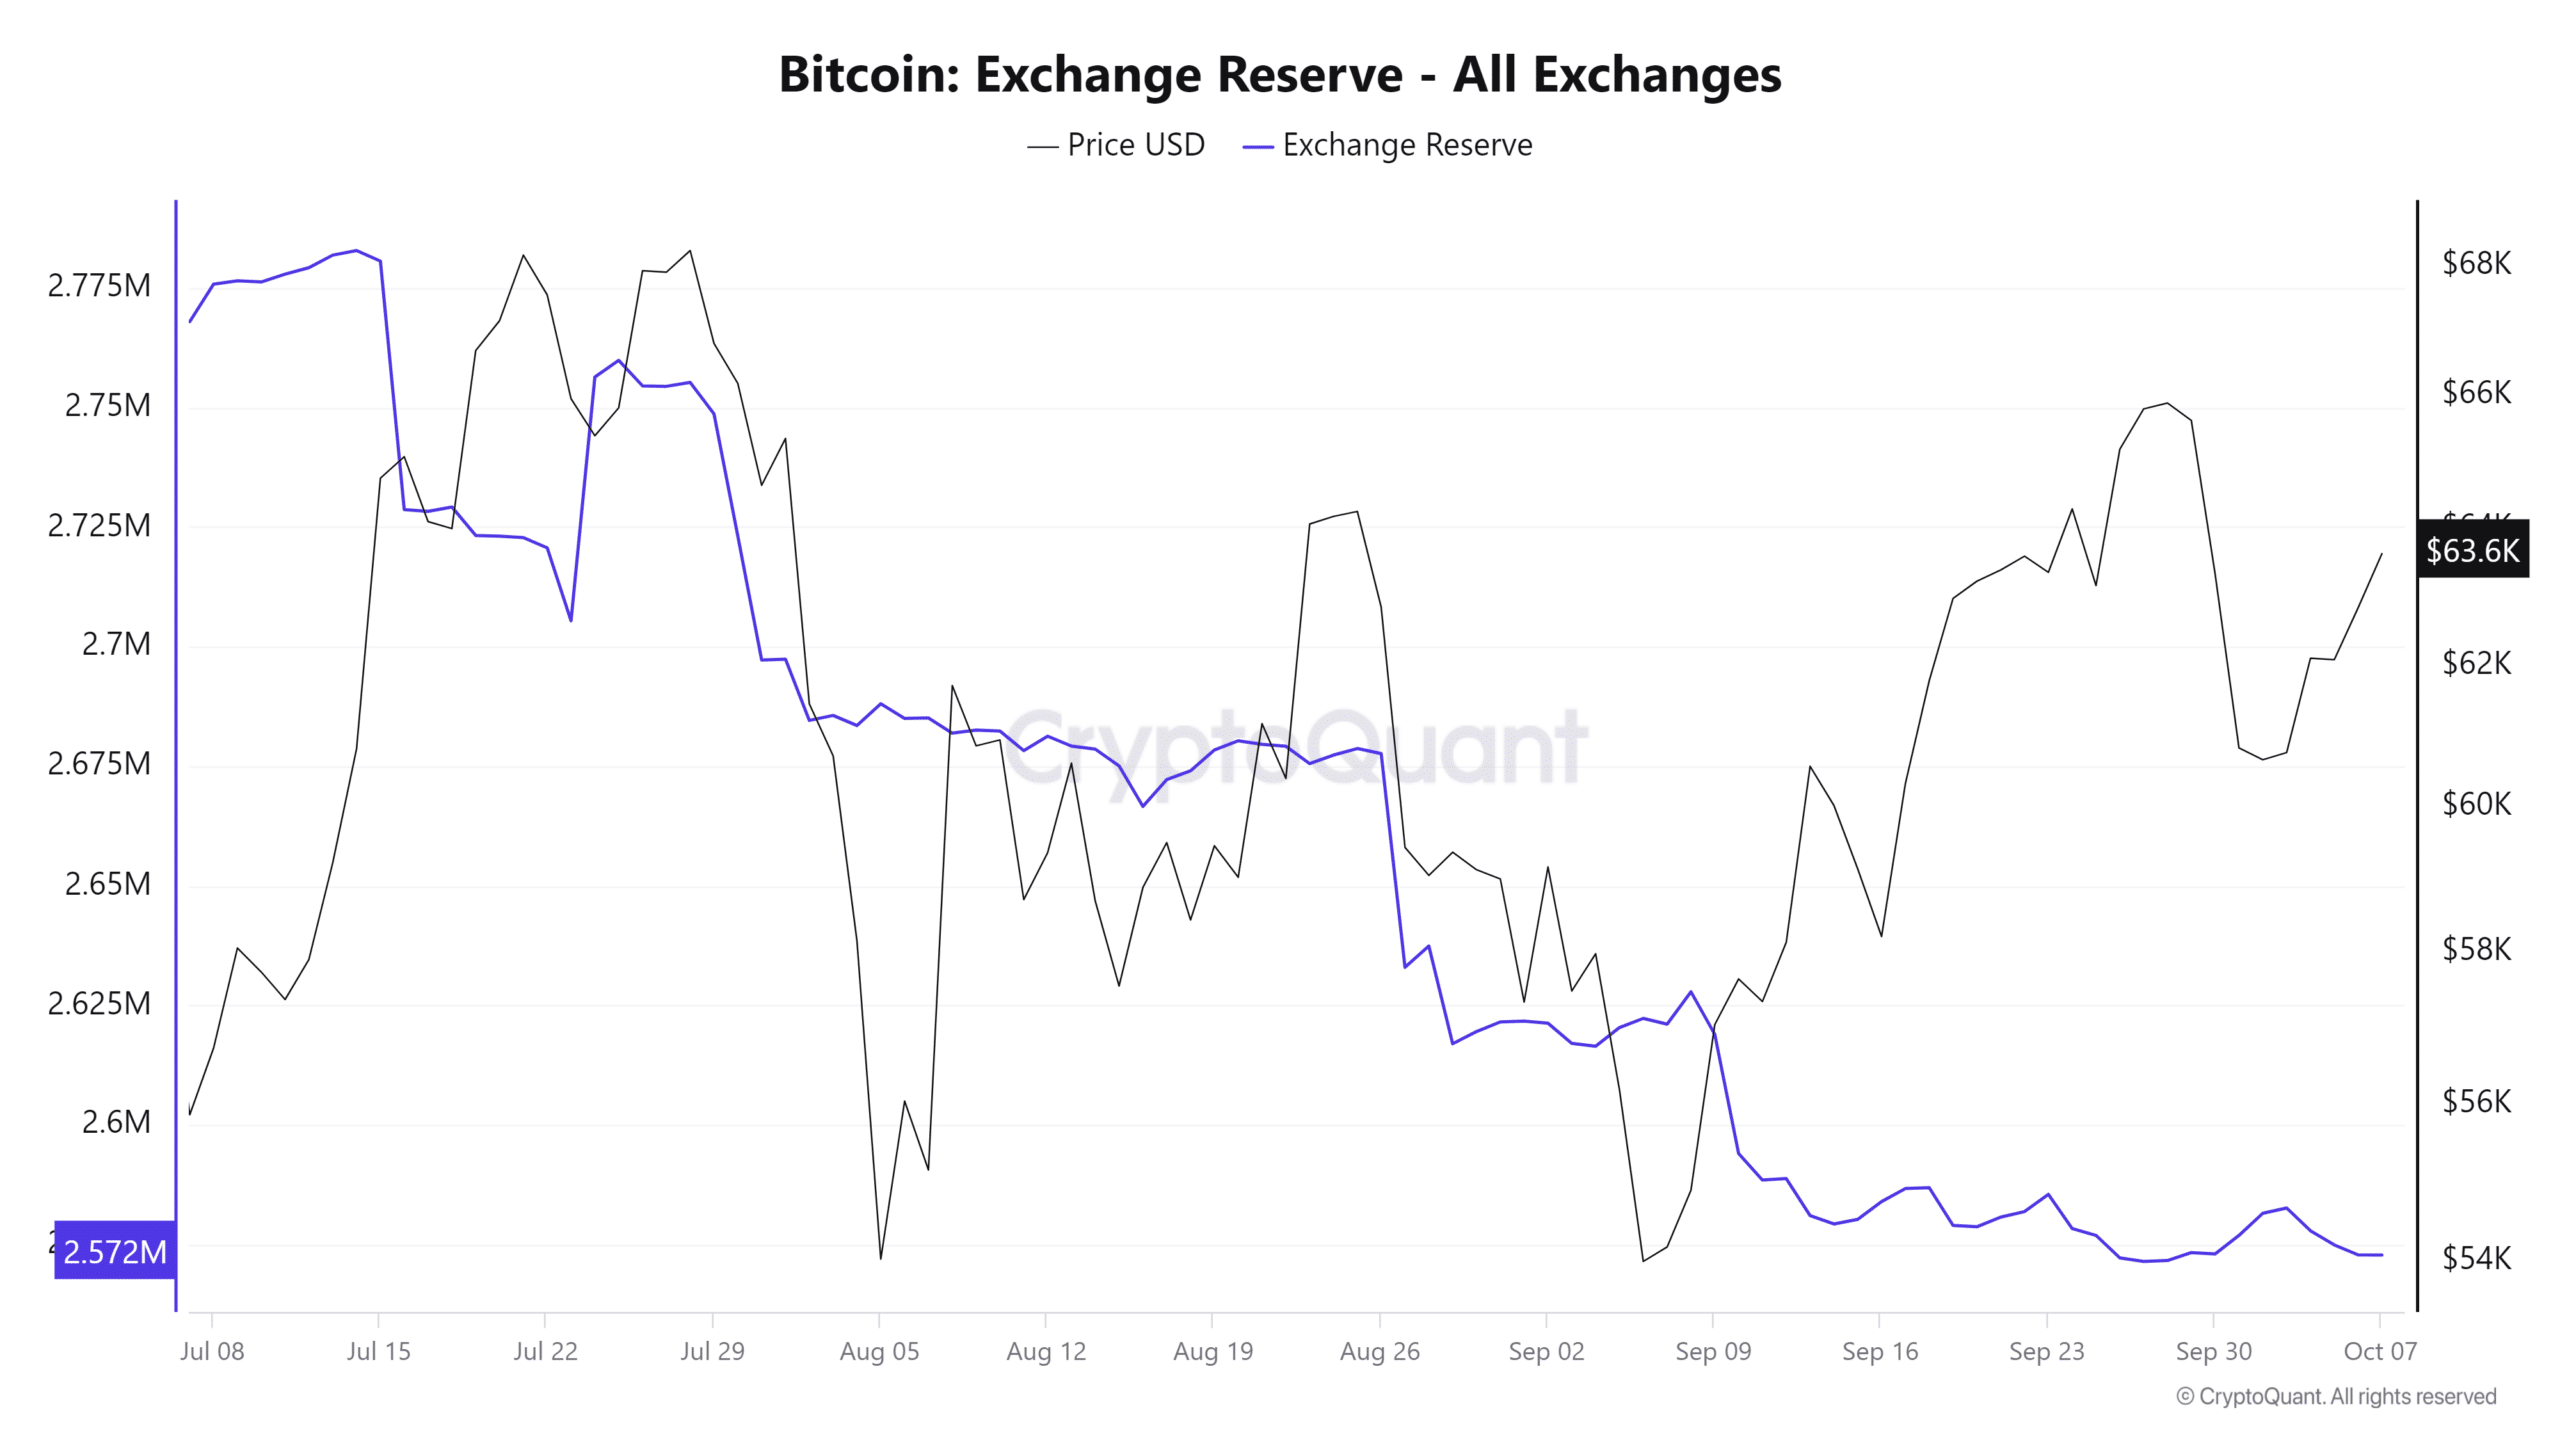
Source: CryptoQuant
This buying pressure is further confirmed by CryptoQuant’s Exchange Stablecoin Ratio. When this metric is low, as it is for BTC, it suggests that available stablecoins are likely being used to buy Bitcoin, pushing its price higher. The current reading of the ratio stands at 0.00009506 and is continuing to trend downward.
If these metrics maintain their downward trajectory, it’s likely that BTC will continue its upward momentum, as market sentiment increasingly favors the bulls.
While these are strong bullish indicators, AMBCrypto has also identified additional metrics pointing to the same conclusion.
Short traders face losses as BTC rises
In the past 24 hours, numerous short traders have been liquidated as Bitcoin’s price moved against their bearish predictions.
Data from Coinglass reveals that approximately $41.80 million worth of short contracts on BTC were wiped out, highlighting a strong bullish shift in the market.
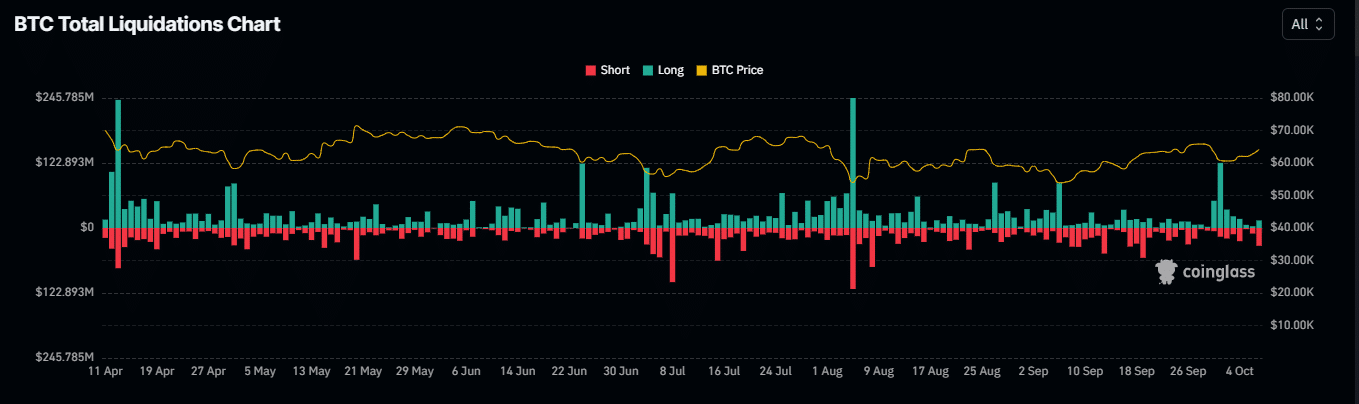
Source: Coinglass
Read Bitcoin’s [BTC] Price Prediction 2024–2025
Additionally, Open Interest, a key metric that measures trader activity, indicates a bullish trend, with a 3.66% increase pushing the total to $34.08 billion.
If this trend continues, BTC’s upward momentum is likely to persist, confirming the bullish sentiment among traders.