
- BTC STHs may have panic-sold in reaction to the recent news about the Bybit hack.
- Analysis of the 90-Day Active Supply reflected a notable decline in recent months.
In the past 24 hours, Bitcoin [BTC] experienced notable volatility. Short-Term Holders (STHs) realized substantial losses, likely driven by panic-selling following the Bybit hack news.
Also, over the past 16 hours, BTC’s 4-hour chart on Binance showed significant bearish indicators.
The Exponential Moving Average (EMA) cross displayed a bearish crossover, with the 9-period EMA dropping below the 26-period EMA around hour 14, signaling short-term downward momentum.
This aligned with BTC’s price decline to $96,259.9, marking a -0.12% drop from the previous period.

Source: CoinGlass
The Relative Strength Index (RSI) stood at 46.05, reflecting a neutral but slightly bearish outlook.
This RSI level suggested that BTC remained in a consolidation phase, with no clear overbought or oversold conditions. If it rebounds above 50, bullish sentiment might return, supporting price recovery.
Also, the Cumulative Volume Delta (CVD) showed a net volume delta of -94.67K, reflecting strong selling pressure in the last 8 hours.
These signals collectively pointed to capitulation, where STHs offloaded BTC, potentially forming a short-term local bottom as selling pressure diminished.
Panic selling peaks: What is the turning point?
The Short-Term Holder Profit & Loss (P&L) to Exchanges Sum chart for the last 24 hours also highlighted significant losses among STHs.
The dominance of red bars, peaking at -43.9K BTC, indicated heavy panic-selling around $90K to $95K following the Bybit hack news.

Source: CryptoQuant
The STH profit line remained minimal, reinforcing the idea that few short-term traders saw gains. Similar trends occurred in early 2022, where high realized losses preceded short-term price recoveries.
This data suggested a potential local bottom, as distressed selling often exhausts downward momentum, creating a possible buying window for traders.
BTC’s liquidity shift
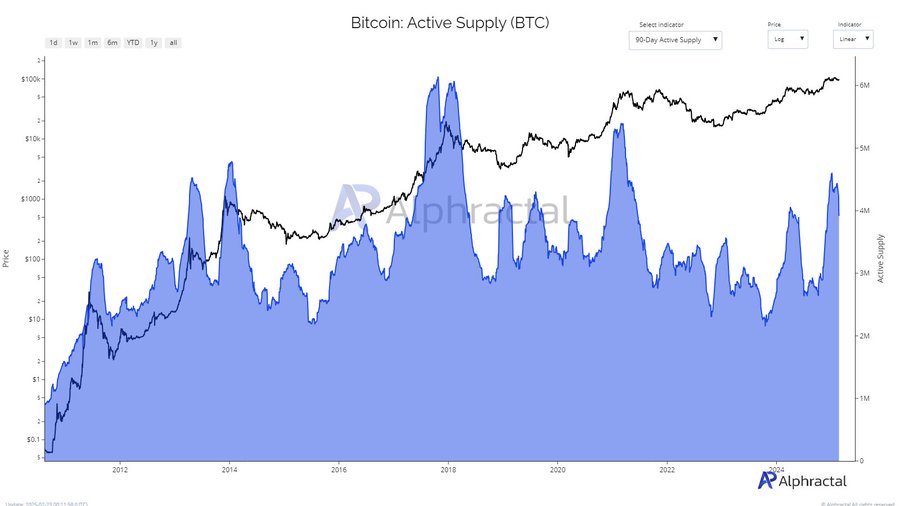
Analysis of the 90-Day Active Supply chart for BTC, covering 2012 to 2025, reflected a notable decline in recent months. As of early 2025, active supply hovered around 4M BTC, down from 6M BTC in late 2024.
Source: Alphractal
This metric, indicated a decline in trading activity. Normally, rising active supply suggests higher demand and bullish sentiment, while declines signal distribution and reduced interest.
The current trend implied STHs had largely exited, potentially reducing selling pressure.
This pattern mirrored 2018, when declining active supply preceded price stabilization, supporting the capitulation hypothesis and reinforcing short-term bottom formation.
A sign of strength or further decline?
Deep analysis showed that BTC netflow chart for aggregated exchanges over the last three months revealed a sharp net outflow of -546.11 BTC in the past 24 hours.
This was a significant reversal from the previous week’s +226.57 BTC average inflows, and the 30-day average of +1.29K BTC inflows.

Source: IntoTheBlock
A sudden negative netflow typically indicates that holders are withdrawing BTC to off-exchange wallets, suggesting reduced selling pressure.
This pattern resembled mid-2021, when large BTC outflows preceded price rebounds. Additionally, the 24-hour netflow change of +269.71 BTC suggested renewed buying interest.
In conclusion, Capitulation events, such as heavy short-term holder losses and declining exchange netflows, historically precede short-term recoveries.
While short-term volatility remains, long-term indicators suggest a potential shift toward recovery as selling pressure subsides.