- Short-term holders have seen their unrealized profits grow, reaching new highs while simultaneously establishing a new support level
- BTC has continued to follow its historical patterns from the last two bull cycles
After hitting a new peak of over $108k in December, Bitcoin has struggled to maintain any momentum on the charts as selling pressure intensified. In fact, at the time of writing, the cryptocurrency was valued at just under $94,000.
However, market reactions, particularly from short-term holders, combined with historical trends, seemed to suggest the asset has strong potential to trend higher.
Short-term holders’ profit surge sets new support base
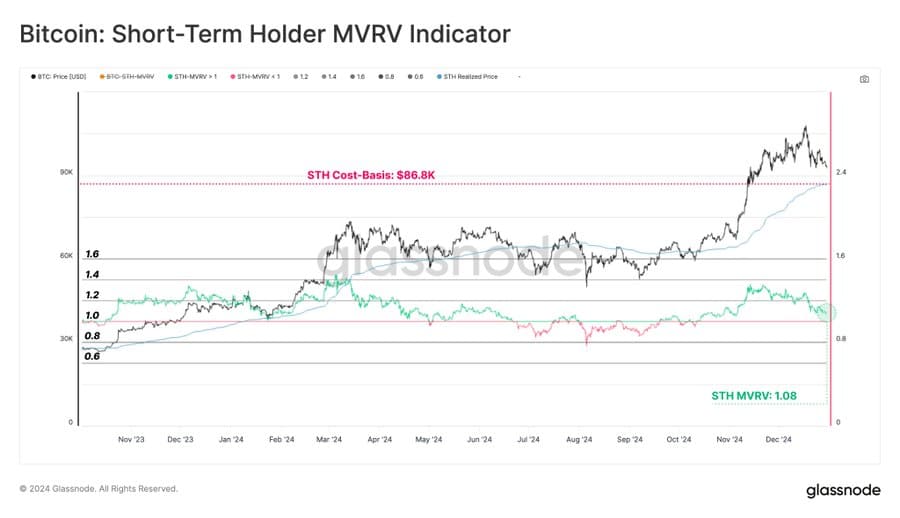
At press time, Glassnode data revealed that there seemed to be a notable surge in the unrealized profits of short-term holders (STH) of Bitcoin (BTC). Here, short-term holders are defined as addresses that have held BTC for no more than 155 days, or roughly five months.
Typically, short-term holders sell for a profit, but in this case, they have chosen to hold, accumulating total gains of over 7.9%. This gain is determined by comparing the Market Value to Realized Value (MVRV) of this cohort.

Source: X
When unrealized profits surge, it typically means that short-term holders are refraining from selling and prefer to hold their BTC. This behavior is considered a bullish signal.
Should this trend continue, the average price at which short-term holders acquired their BTC—around $86,600, as indicated by the chart—will likely serve as a new support level for the price to trend higher from its press time point.
In other words, if Bitcoin falls, this aggregate cost-basis would act as a significant support level. This would prevent further price declines, potentially fueling sustained upward momentum.
Historical data shows BTC could rally higher
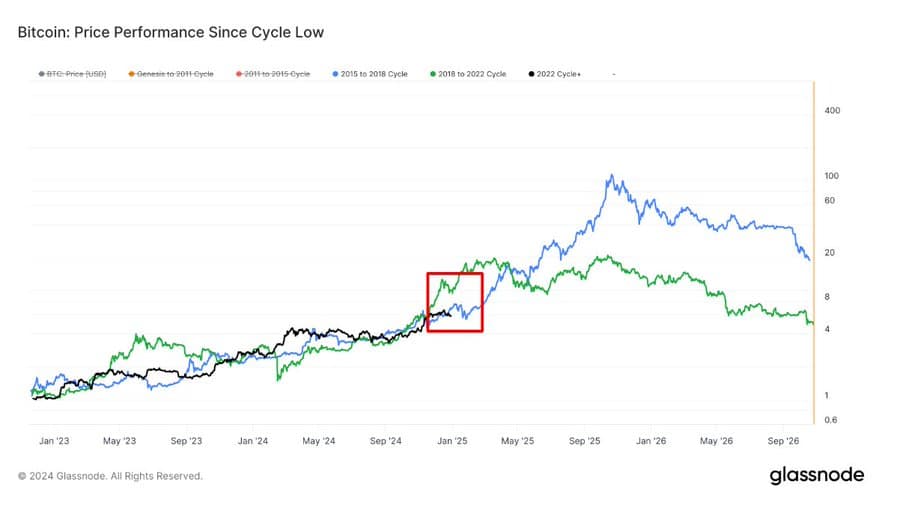
According to analyst James Van Straten, the ongoing 15% price drop in Bitcoin follows historical market cycles, which have previously recorded similar, slight declines.
His analysis also noted that there is potential for BTC to rally further, although it could see additional drops heading into January.


Source: X
However, several key events could still significantly impact Bitcoin’s market trajectory, including the upcoming presidential inauguration of Donald Trump on 20 January.
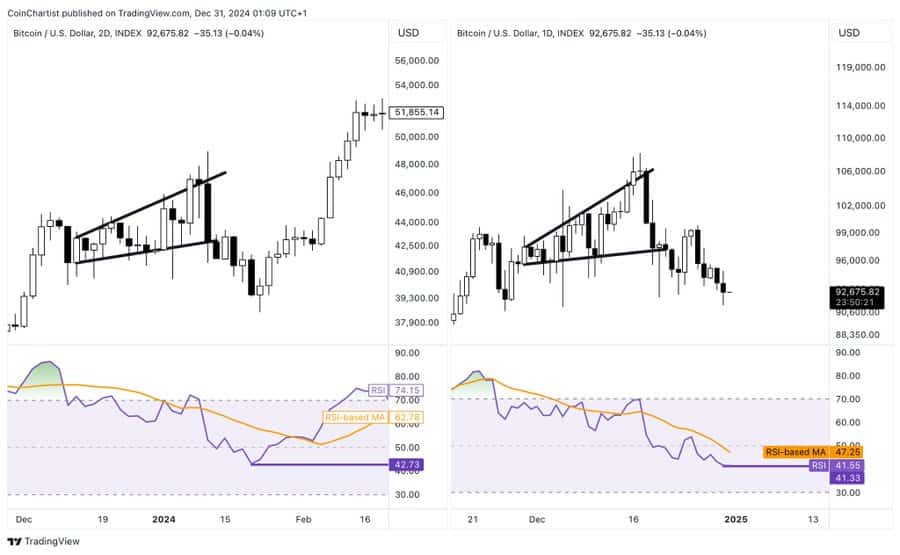
Others like analyst TonytheBullBTC found that BTC is following a historical pattern, one similar to one seen earlier in January last year – A trend that led to its rally to a new high.
According to him,
“The [current] corrective behavior in Bitcoin remains similar [to that of January], albeit at twice the speed.”


Source: X
The two days timeframe chart on the left illustrated how BTC entered a corrective phase before its subsequent rally, which led to a new high of $73,777 earlier in 2024.
On the right, BTC seemed to be following the same pattern, as shown on the daily chart. If this pattern fully materializes by January 2025, BTC could hit a new all-time high, as suggested by broader market outlooks.
Overall, BTC remains bullish, with short-term holders and historical data playing crucial roles in its potential price movements.

