- Chainlink has regained its bullish structure on the daily chart.
- There was evidence for accumulation over the past month, but the weighted sentiment remained bearish.
Chainlink [LINK] has flipped its daily market structure bullishly after climbing past the $23.83 level on the 17th of January. The bullish structure was accompanied by rising demand and a shift in momentum.
Source: LINK/USDT on TradingView
The 61.8% Fibonacci level was retested and the psychological $20 zone was not relinquished despite the bearish sentiment across the market in recent weeks. It was likely that the recovery could turn into an uptrend that could drive Chainlink beyond $31.
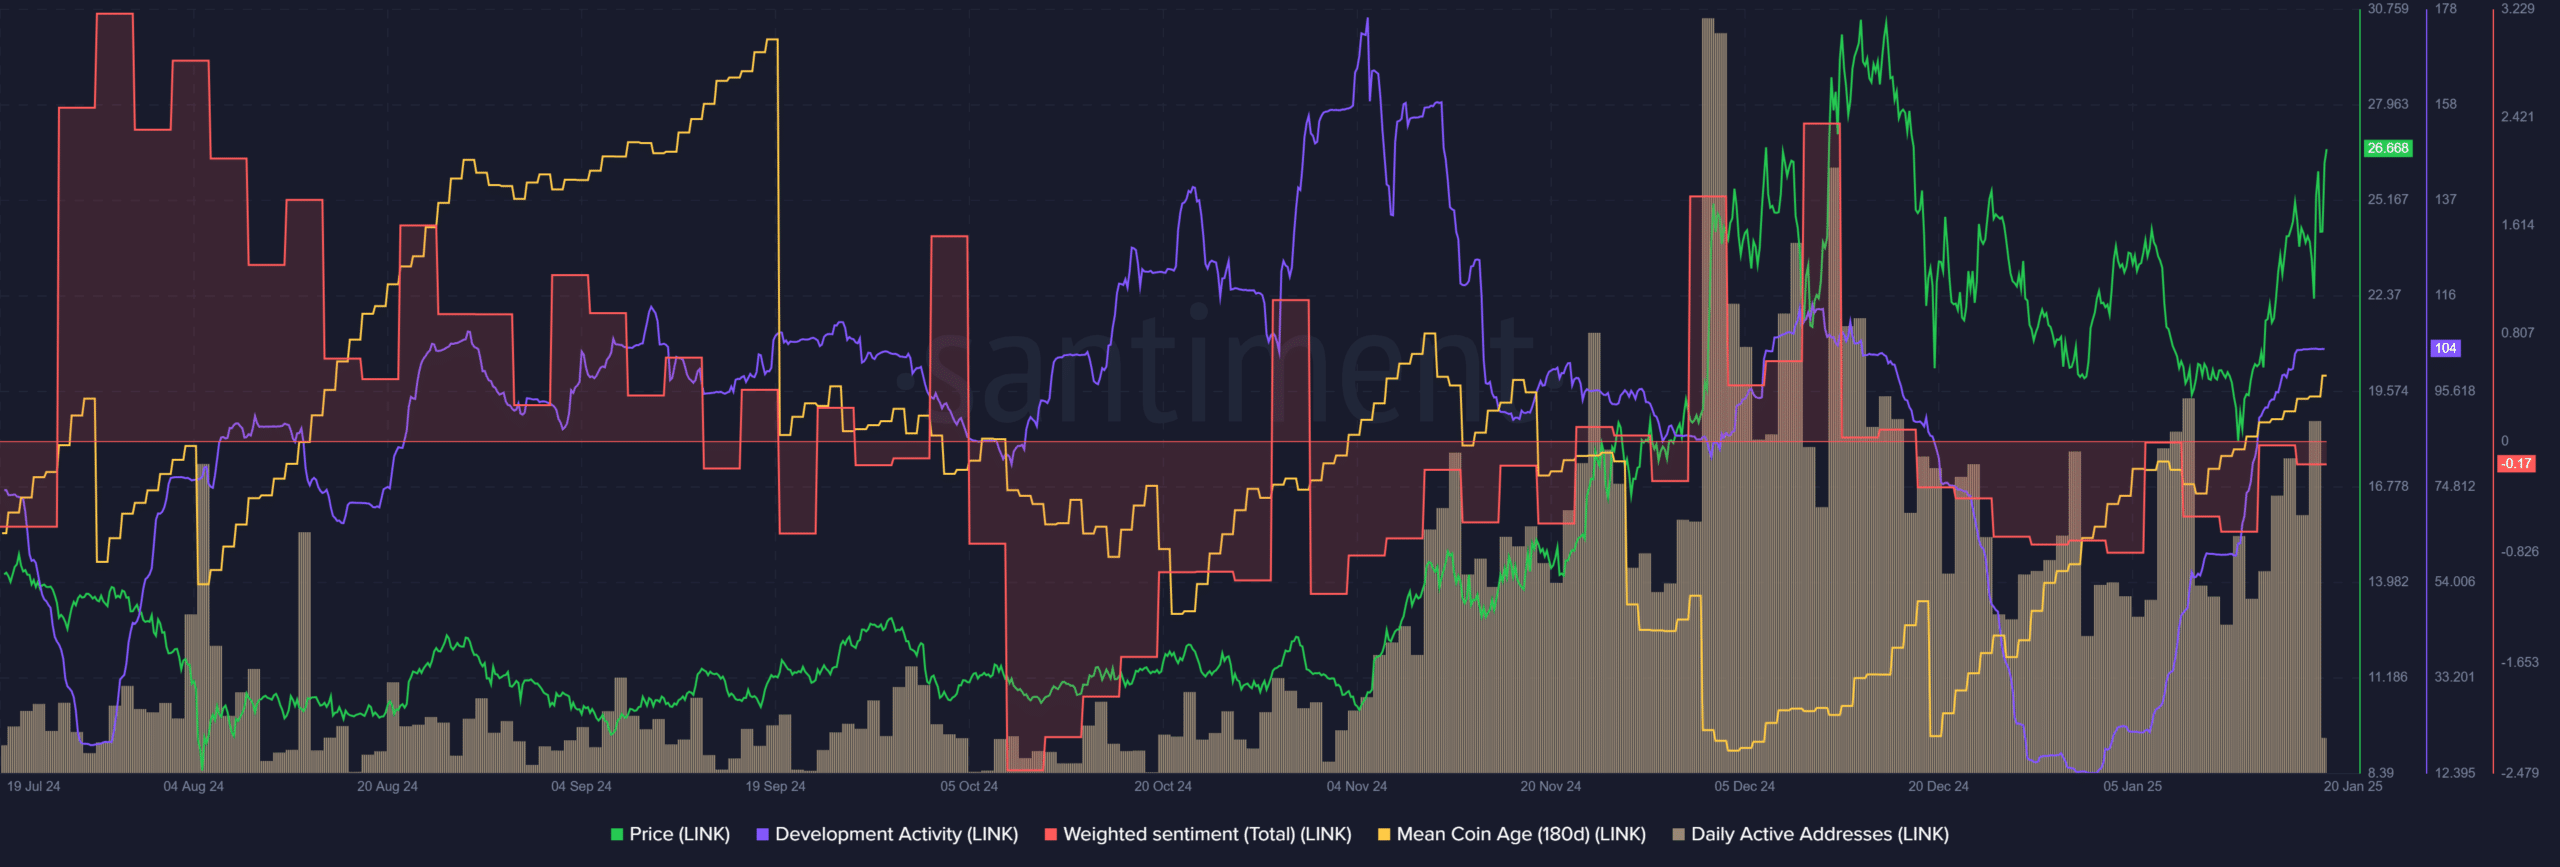
Daily active addresses of Chainlink users show…


Source: Santiment
During the holiday season, LINK’s development activity dropped significantly but remained respectable compared to other large-cap altcoins. In the first week of January, dev activity began to recover and regained mid-December levels.
During this time, the 180-day mean coin age trended higher, indicating accumulation. Daily active addresses peaked in December when prices nearly surpassed $30. Since then, daily on-chain activity has fallen but hovered around late-November levels.
High activity and accumulation signs were strongly bullish. Investors would be buoyed by the resurgent dev activity. The minor drawback was the consistently negative weighted sentiment over the past month.
NVT ratio signals caution


Source: Glassnode
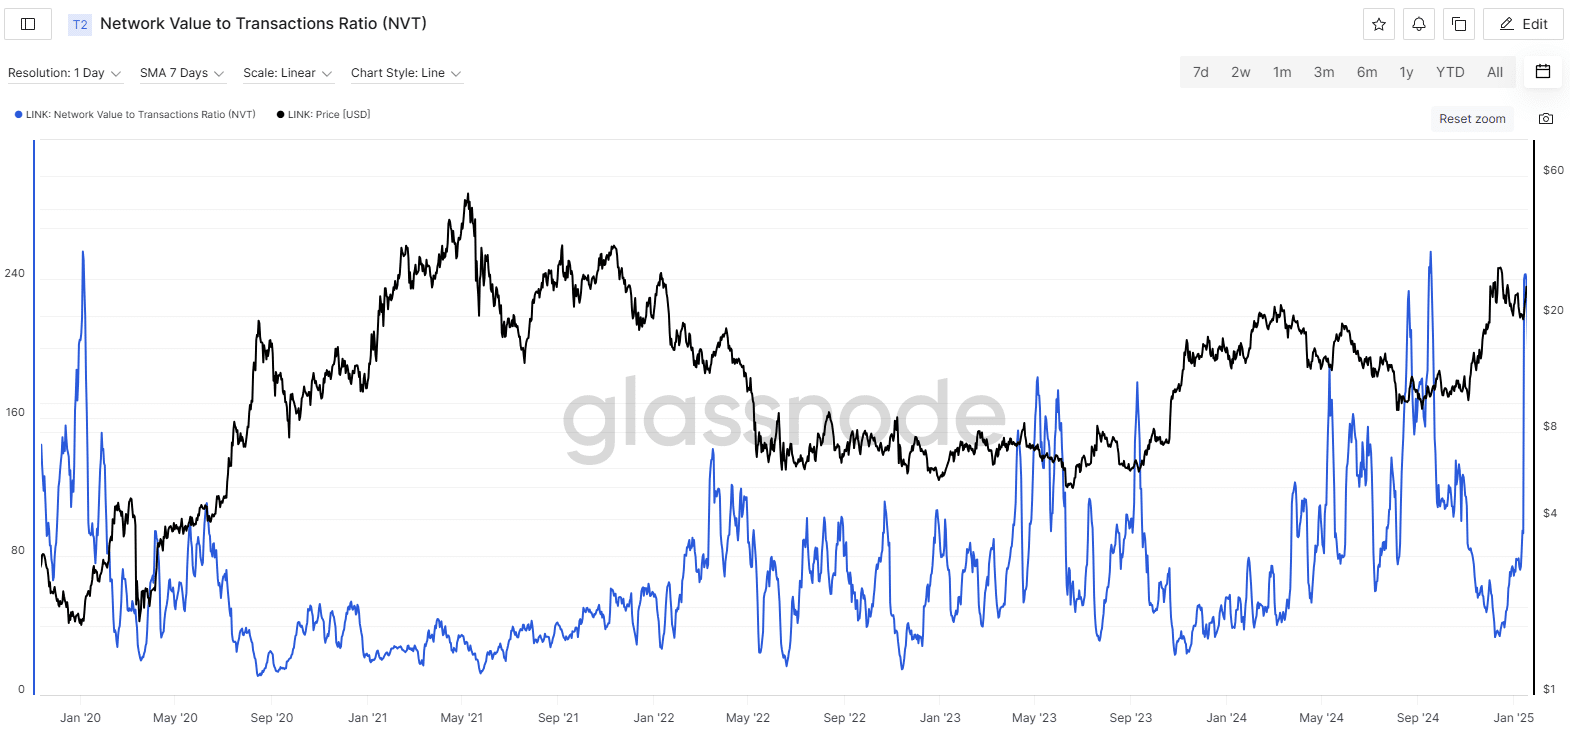
While there was evidence for accumulation among longer-term holders, the Network Value to Transactions (NVT) Ratio has surged higher. This is typically a signal that an asset is overvalued.
The NVT divides the transferred on-chain volume by the market cap of the token., both measured in USD.
Is your portfolio green? Check the Chainlink Profit Calculator
A rising NVT Ratio signals a drop in on-chain volume, or steady volumes, and a rapid increase in market cap (and price).
In either scenario, it suggests the possibility that the price is outpacing the transaction volume, signaling overvaluation and a potential correction ahead.
The NVT was nearly at September 2024 highs and just below the January 2020 highs. By itself, it does not guarantee a deep price correction but should serve as a warning sign.

