- Despite overtaking Solana, ETH’s NFT trade volume dropped last month
- ETH’s price depreciated by over 7%, and market indicators were bearish too
Ethereum [ETH] took somewhat of a backseat over the last few months as Solana [SOL] challenged it in the NFT ecosystem. However, the trend changed recently as ETH beat Solana on this front. Hence, it’s worth seeing how Ethereum’s NFT ecosystem actually performed.
Ethereum outshines Solana
Coin98 Analytics recently shared a tweet highlighting an interesting development in the NFT space. According to the same, Ethereum registered the highest amount of NFT sales volume in the last 30 days.
Apart from ETH, SOL and BTC also made it to the top three on the same list. To be precise, ETH’s organic NFT sales touched $137 million last month. Meanwhile, SOL and BTC’s numbers stood at $101 million and $75 million, respectively.
AMBCrypto then took a look at DappRadar’s data to find out the top performing NFT collections of Ethereum. We found that Liberty Cats, Pudgy Penguins, and Bored Ape Yacht Club were the top three NFT collections over the last 30 days.
However, when we checked Santiment’s data, a different story came to the fore. As per our analysis, ETH’s NFT trade counts dropped sharply last month. On top of that, its NFT trade volume in USD also fell during the same period.
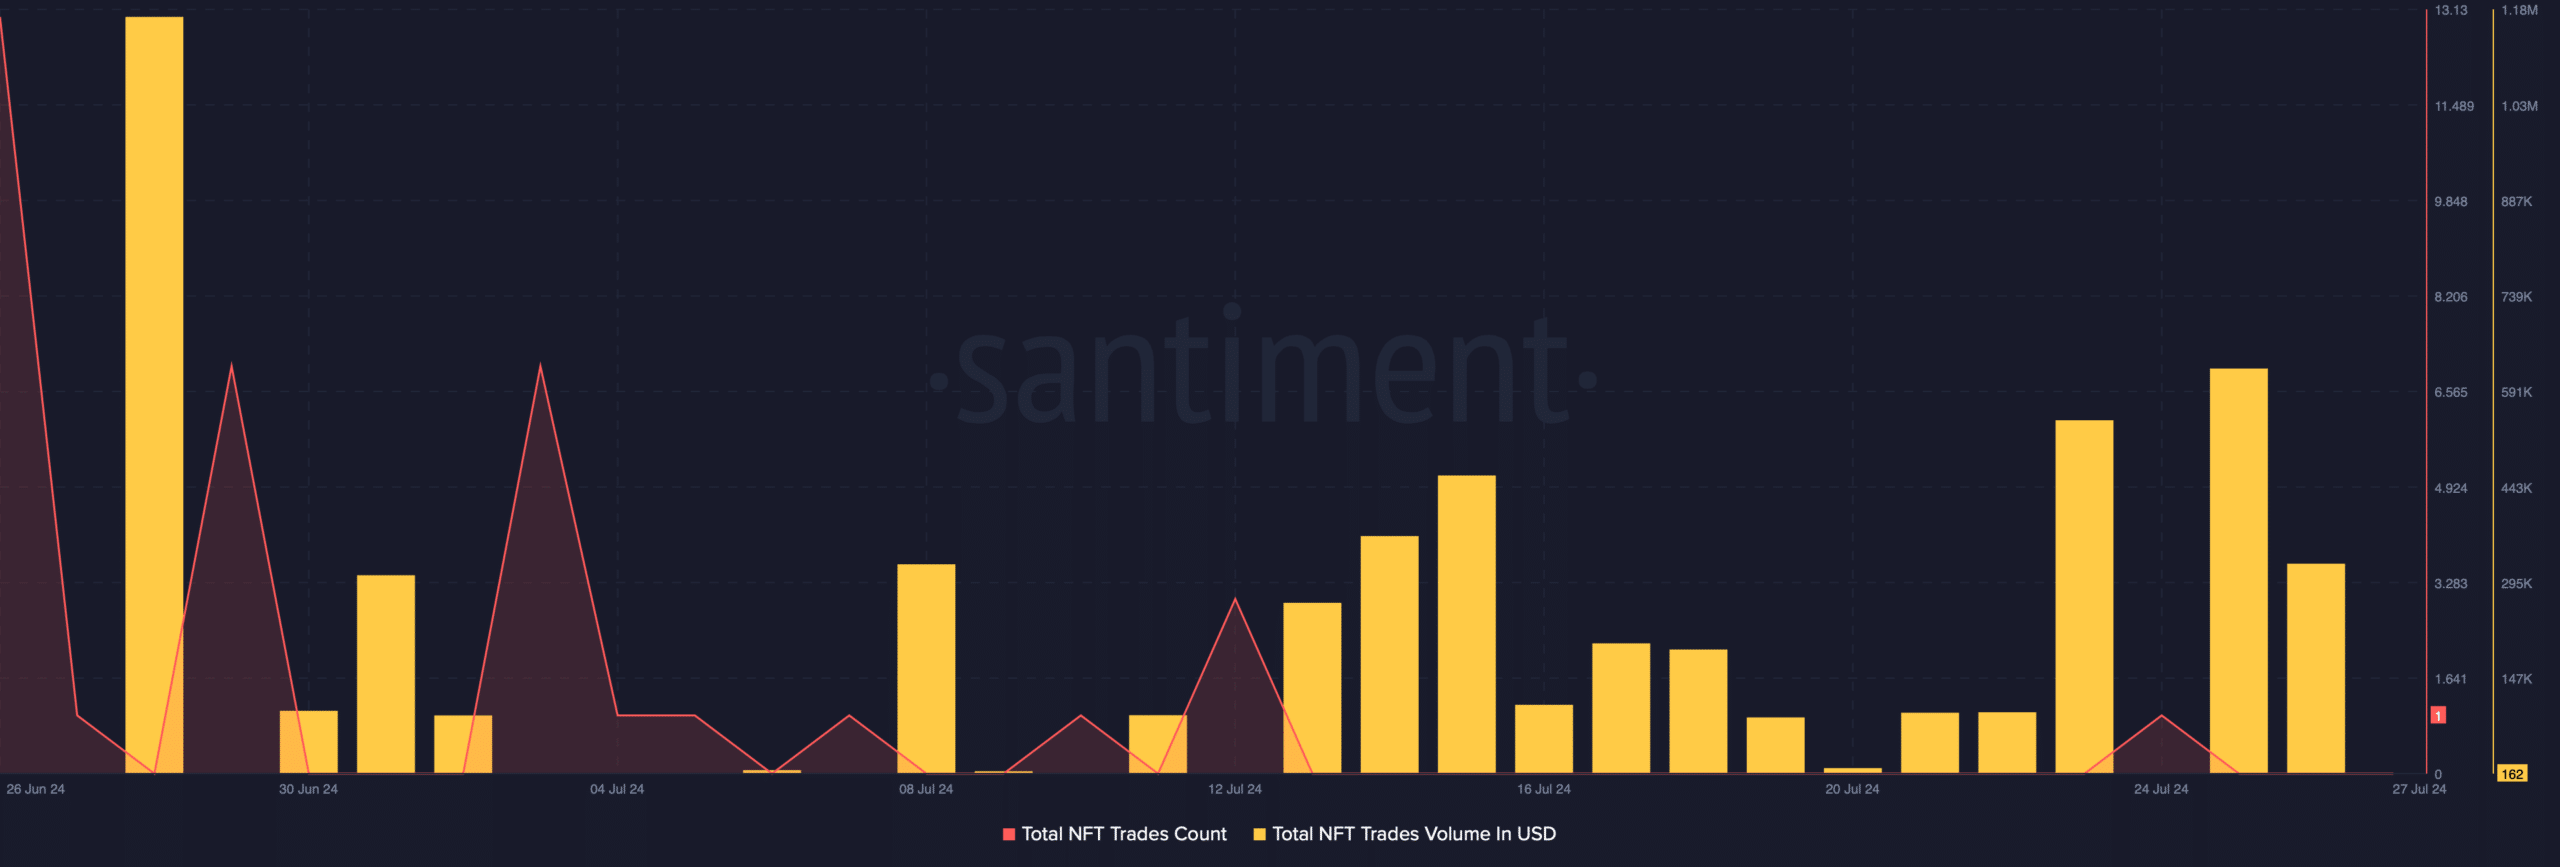
Source: Santiment
Cryptoslam, a popular analytics platform that shares insights on NFTs, also suggested that ETH NFTs witnessed a decline in terms of sales last month.
As per the data, Ethereum’s NFT sales volume declined by 39% last month. A similar declining trend was also seen in terms of its number of sellers and NFT transactions, as the values dipped by 3.22% and 59%, respectively.
Nonetheless, ETH’s number of NFT buyers did hike marginally over the aforementioned period.

Source: Cryptoslam
A look at ETH’s state
While all this happened in the NFT space, ETH bears took control of the market as its price dropped by more than 7% last week. At the time of writing, ETH was trading at $3,258.75 with a market capitalization of over $391 billion.
A look at the token’s daily chart will be key to finding out whether this bearish trend would continue or not.
According to our analysis, the technical indicator MACD flashed a bearish crossover. Ethereum’s Relative Strength Index (RSI) registered a downtick. The altcoin’s Money Flow Index (MFI) also moved south, suggesting that the chances of a sustained price decline were high.
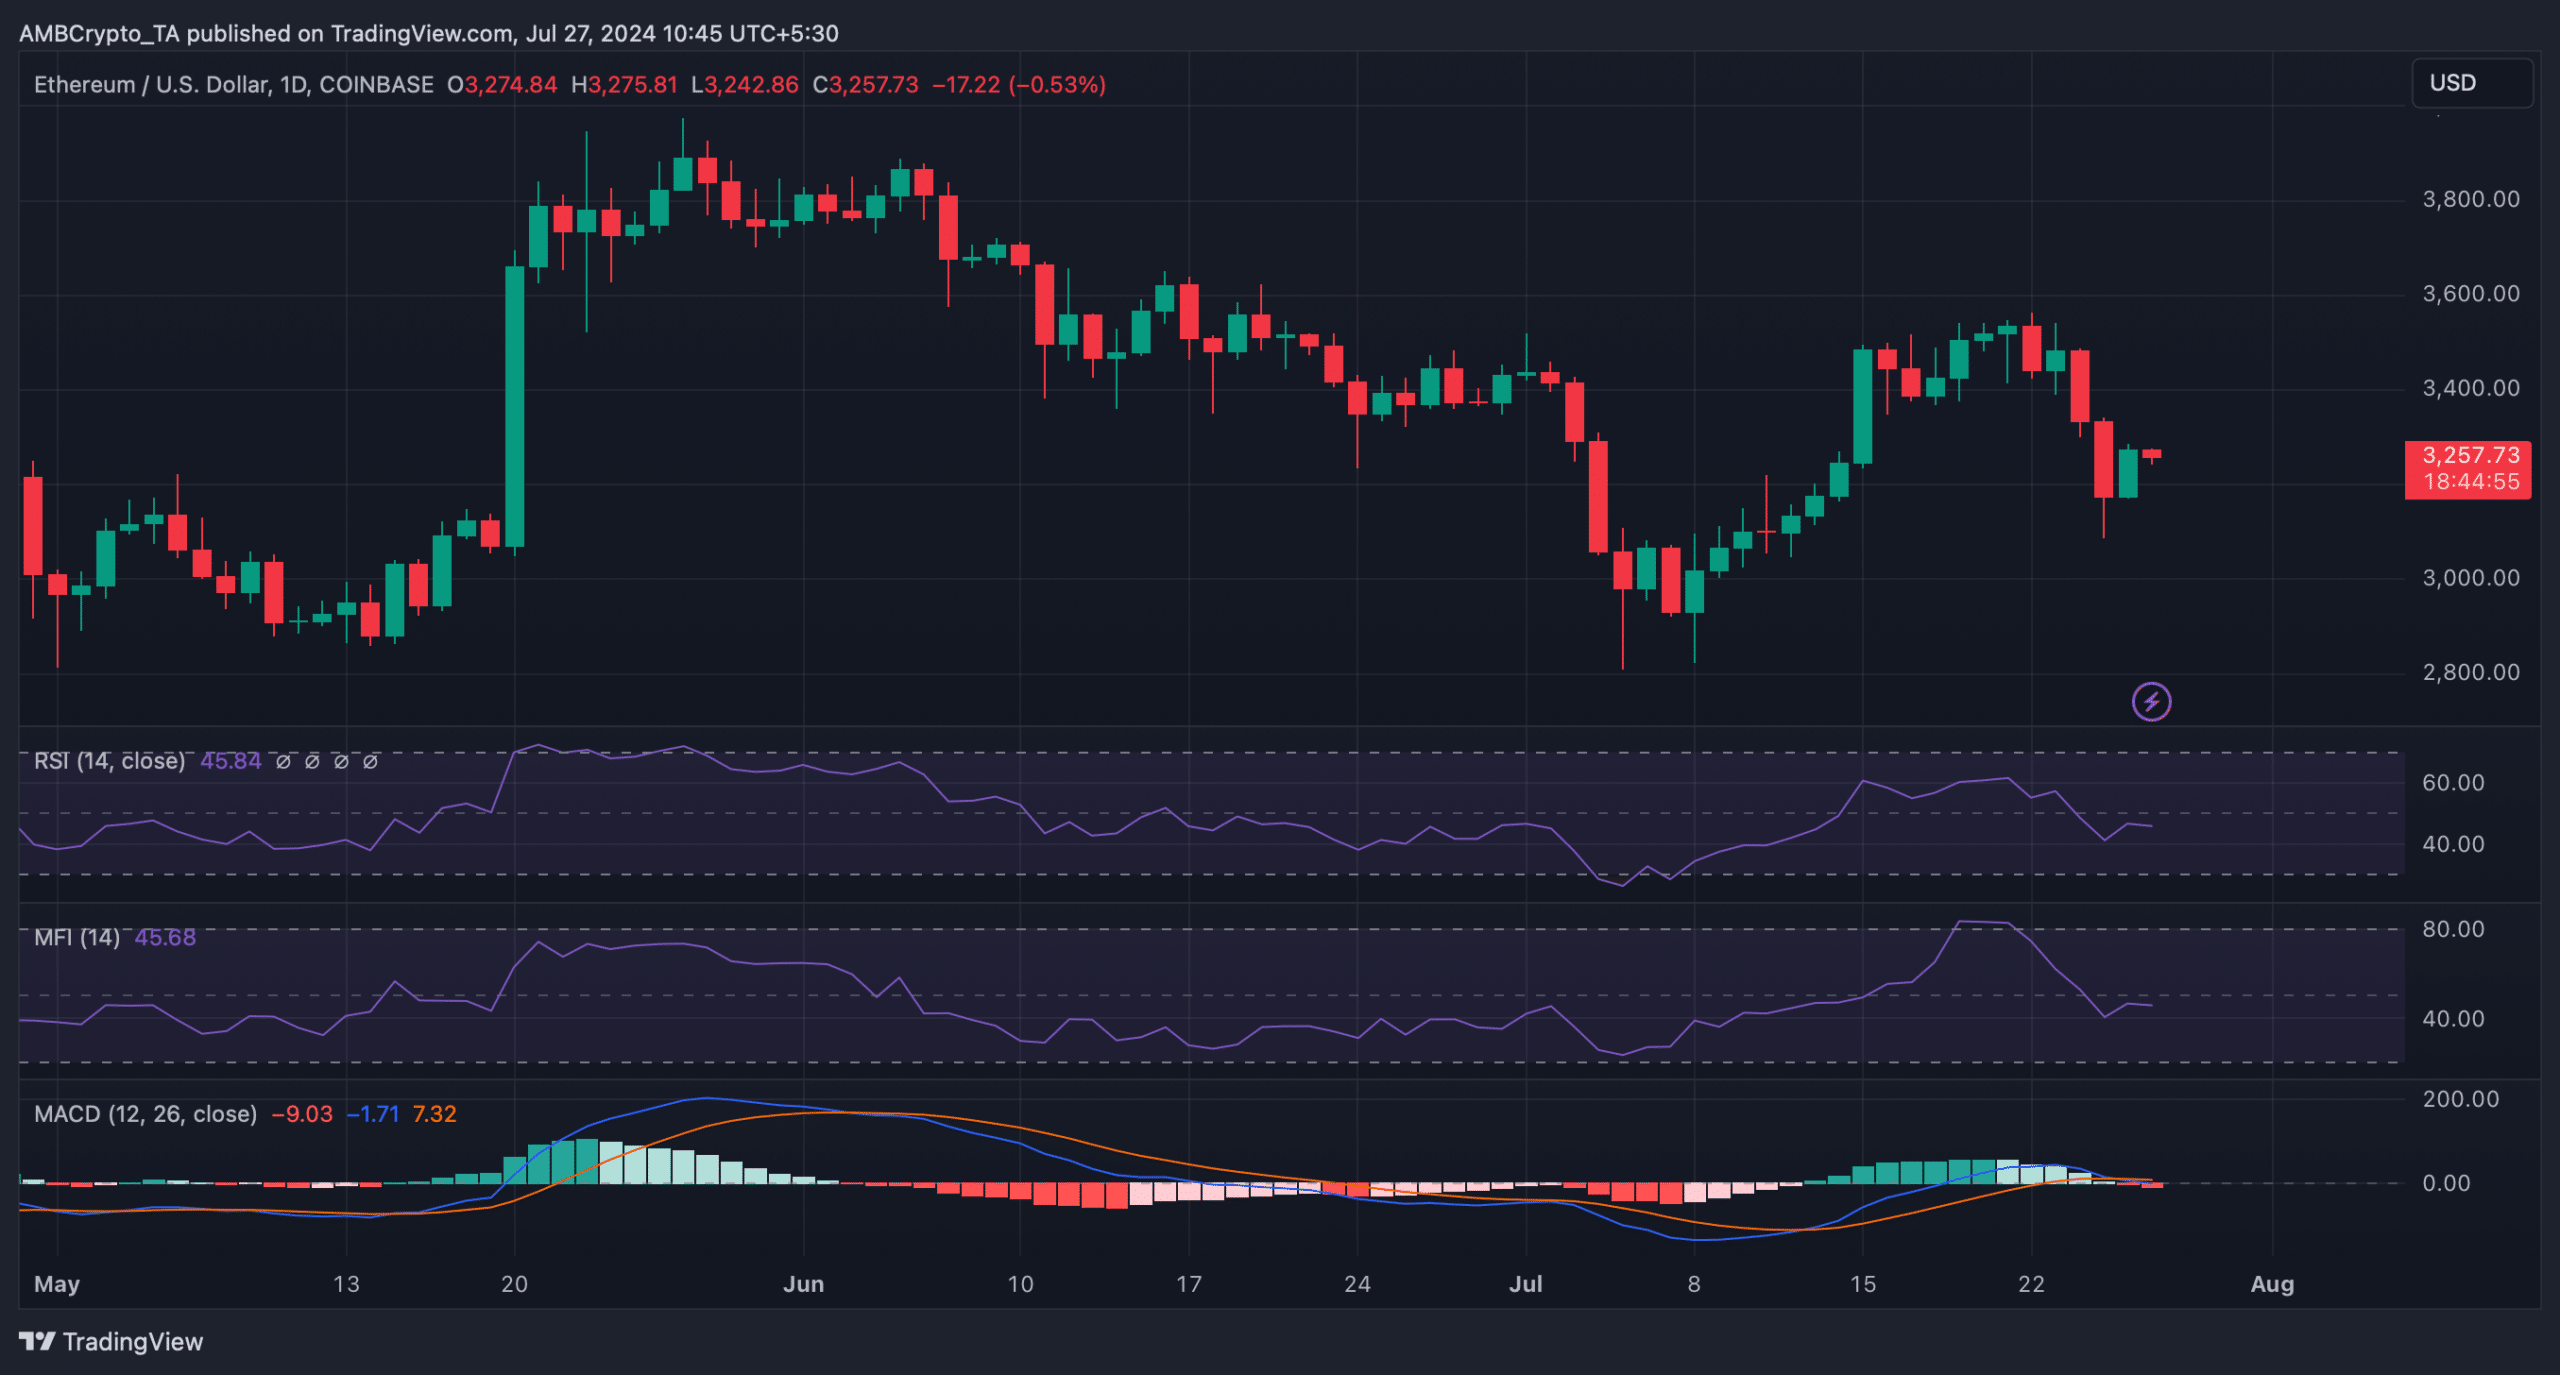
Source: TradingView
Read Ethereum’s [ETH] Price Prediction 2024-25
On the contrary, at the time of writing, ETH’s fear and greed index had a reading of 39%, meaning that the market was in a “fear” phase. Whenever the metric hits this level, it indicates that there might be an opportunity for a bull rally.