
- A technical inverse head-and-shoulders pattern suggested that HBAR may be gearing up to breach a crucial resistance level
- Both technical indicators and on-chain metrics flashed signs of a potential rally
Over the last 24 hours, HBAR has gained by 3.34% on the charts, building on a 6.86% hike in recent weeks. Taken together, this is a sign of sustained growth, which by extension, could highlight the possibility of further price hikes in the future.
In fact, analysis indicated that HBAR could surge by as much as 37% or more if it successfully breaks through the identified resistance level.
Critical resistance marks the final hurdle for HBAR rally
At the time of writing, HBAR seemed to be trading within an inverse head-and-shoulders pattern—A classic formation that often signals an impending upward rally.
However, for this bullish move to materialize, HBAR must first break through the key resistance, commonly referred to as the neckline. A successful breach of this level could propel the crypto by 37.89%, pushing its price to approximately $0.429.
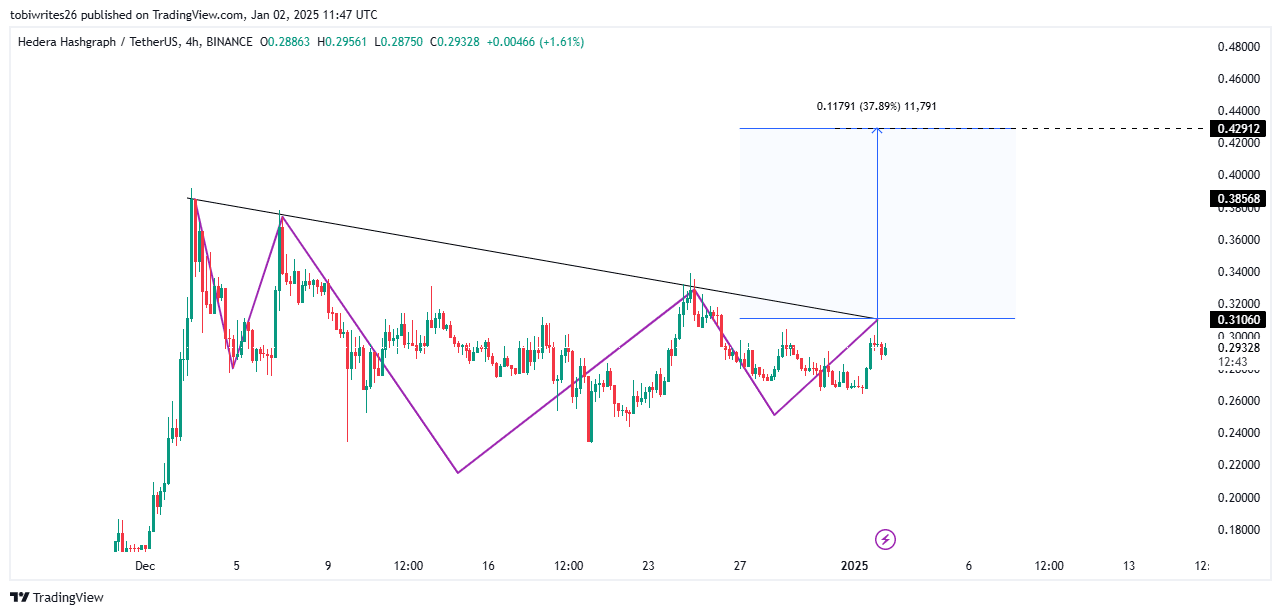
Source: TradingView
While there’s a chance that HBAR’s price may temporarily stall before crossing the resistance level, technical indicators strongly suggested an upward move may be likely.
Indicators point to increasing buying activity
The Parabolic SAR (Stop and Reverse) indicator formed its dotted markers below HBAR’s price candles – A sign of an greater buying activity and a higher likelihood of a rally.
If these dots continue to appear under the price candles, it would mean sustained upward momentum, potentially leading to new higher highs as HBAR trends towards its price target.
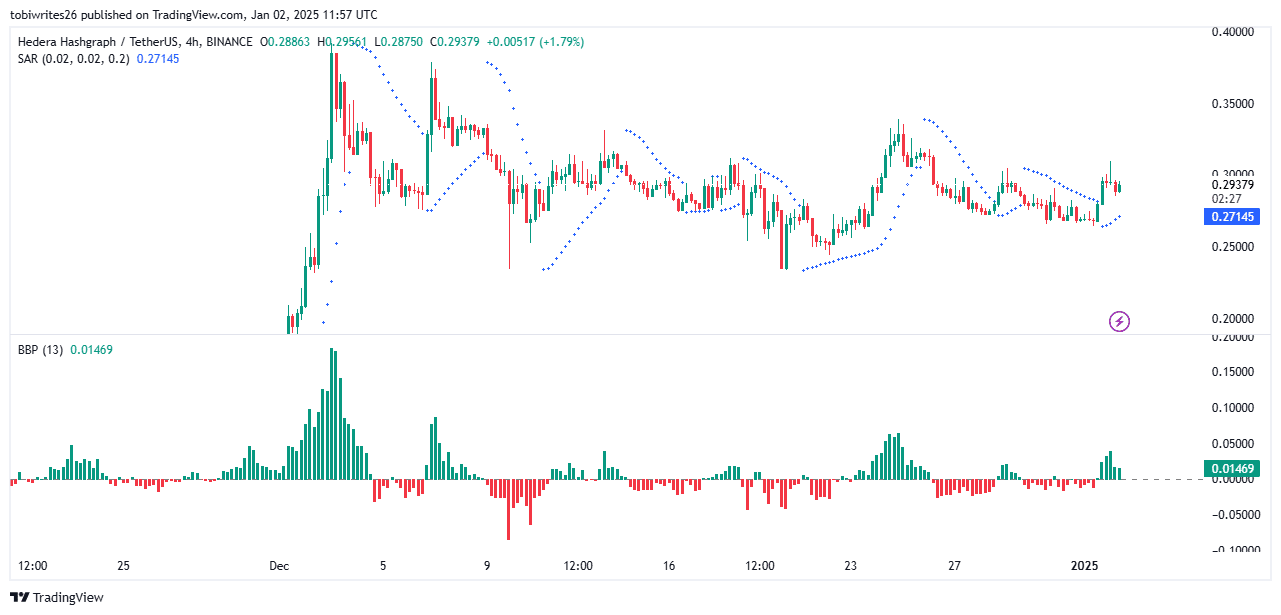
Source: TradingView
Similarly, the Bull Bear Power (BBP) displayed six consecutive green histogram bars, indicating that bullish traders have been the driving force behind HBAR’s recent growth.
Should the number of bullish histogram bars increase further, it would reinforce expectations of a continued price hike. This would also imply heightened confidence in HBAR’s upward trajectory among traders.
More underlying buying pressure
Over the last 24 hours, HBAR has seen a notable increase in Open Interest (OI). In fact, data from Coinglass underlined a 9.90% hike, bringing the total OI to $269.71 million.
Such a surge usually indicates an uptick in the number of unsettled derivative contracts tied to HBAR. Combined with the asset’s 3.34% price gains and a positive funding rate, it meant that a majority of these contracts are being held by long positions.
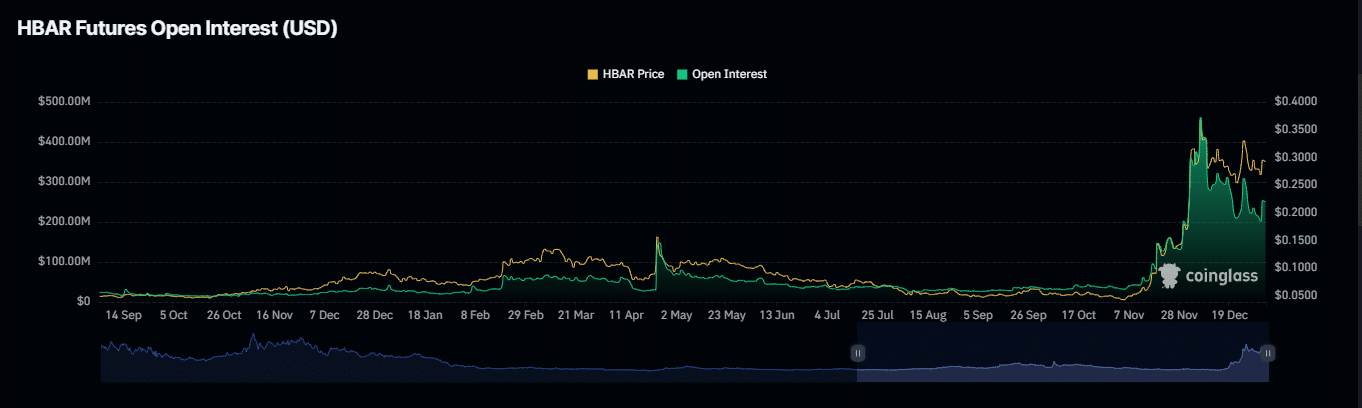
Source: Coinglass
The funding rate, which determines whether bulls or bears are paying a premium to maintain their positions, had a value of 0.0125% at press time—A relatively high value. This alluded to a strong level of confidence among bullish traders, increasing the likelihood of sustained upward price movement.
However, at the time of writing, positive exchange netflows had temporarily delayed HBAR’s breakout above the resistance neckline.
According to Coinglass, $1.79 million worth of HBAR was recently moved to exchanges – A sign of selling activity that has slowed the rally.
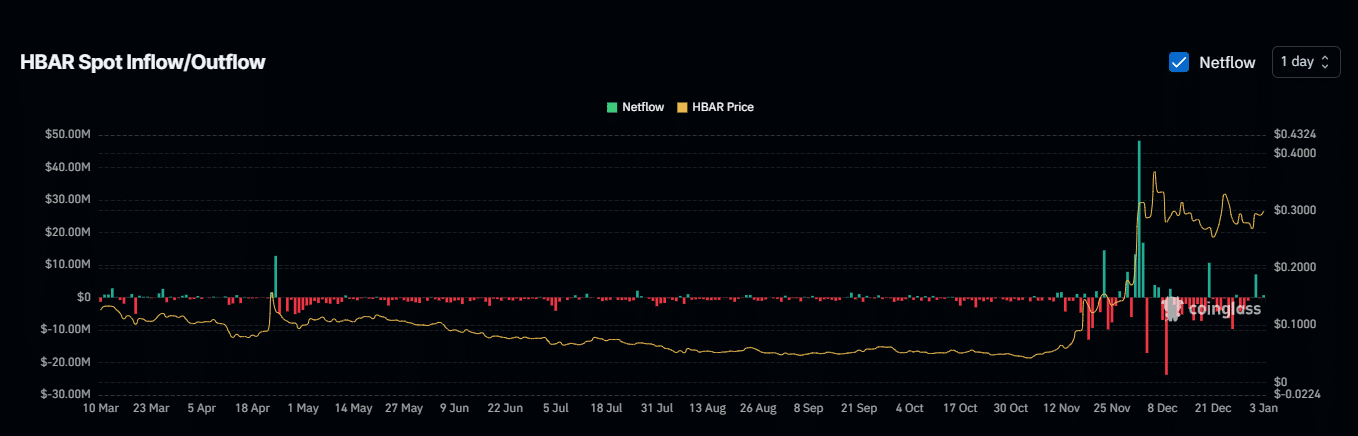
Source: Coinglass
If netflows turn negative—indicating traders are withdrawing assets from exchanges for long-term holding—HBAR could resume its upward trajectory and potentially breach the critical resistance level.