The NFL is back for Week 1 of a brand new season, and we’re back to bring you score projections for every game of that season. If you’re new to this series, I project the score for every game and the chance of victory for every team using my NFL Projection Model.
So, let’s get into Week 1! We have 16 games, starting with the NFL Kickoff Game in Kansas City on Thursday Night. In the table below, you can find the model’s projected point spread and total for all 16 games, compared side-by-side with the betting odds. Using those side-by-side comparisons, you can see where you might have an edge over the sportsbooks and teams might cover the spread or total.
My model takes in a range of different metrics and creates a projection for each team. Those projections are then used to project a spread and total for each game. You can find my best bets for Week 1 here. As always, I encourage you to shop around for the best bets and best prices before you make any bets.
NFL Week 1 model projections
“XMOV” is the model’s projected point differential for the game with the BetMGM spread (“LINE”) as of publish time listed to the right of it. “XTOTAL” is the projected combined point total with the BetMGM total (“TOTAL”) listed as of publish time to the right of that number. “XWIN” is the model’s projected chance of that team winning. Where it says “pick,” that means the model projects the game as too close to call. The spread is listed next to the home team, and the total is listed next to the away team in each matchup.
| Team | xMOV | LINE | xTOTAL | TOTAL | xWIN |
|---|---|---|---|---|---|
|
47.5 |
46.5 |
40.7% |
|||
|
-3 |
-3 |
59.3% |
|||
|
47.5 |
49 |
46.0% |
|||
|
-2 |
-2 |
54.0% |
|||
|
49 |
49 |
35.0% |
|||
|
-4 |
-3.5 |
65.0% |
|||
|
43 |
42 |
40.7% |
|||
|
-3 |
-3 |
59.3% |
|||
|
40 |
41 |
50.0% |
|||
|
pick |
+1.5 |
50.0% |
|||
|
41.5 |
42 |
32.7% |
|||
|
-5 |
-4 |
67.3% |
|||
|
42 |
40.5 |
26.3% |
|||
|
-7 |
-8.5 |
73.7% |
|||
|
43 |
45 |
36.6% |
|||
|
-3.5 |
-3.5 |
63.4% |
|||
|
47.5 |
47.5 |
26.3% |
|||
|
-7 |
-6.5 |
73.7% |
|||
|
47.5 |
49 |
52.9% |
|||
|
+1.5 |
+3 |
47.1% |
|||
|
42 |
40.5 |
40.7% |
|||
|
-3 |
-3 |
59.3% |
|||
|
42 |
42.5 |
33.8% |
|||
|
-4.5 |
-3.5 |
66.2% |
|||
|
41 |
42 |
29.1% |
|||
|
-6.5 |
-6 |
70.9% |
|||
|
43 |
40.5 |
50.0% |
|||
|
pick |
-2.5 |
50.0% |
|||
|
52.5 |
52.5 |
36.6% |
|||
|
-3.5 |
-3.5 |
63.4% |
|||
|
44.5 |
44 |
32.0% |
|||
|
-5.5 |
-4 |
68.0% |
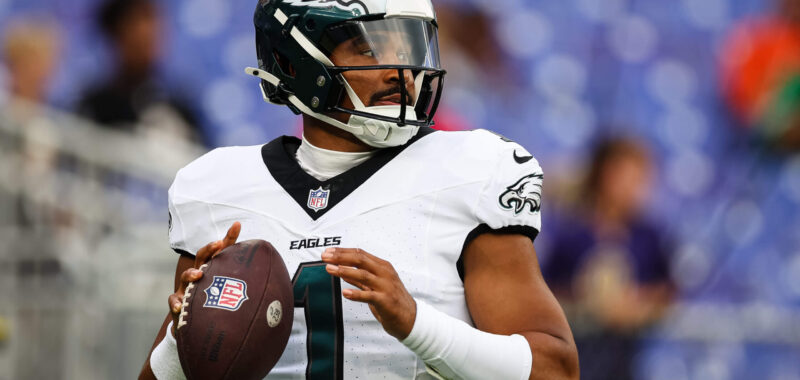
(Photo of Jalen Hurts: Scott Taetsch / Getty Images)

