
- PEPE hit the upper band of the Bollinger Bands it has been trading within
- Some participants seemed to be aligned with a drop, while the market maintained its bullish structure
Over the last 24 hours, PEPE has been on a downtrend, with a minimal loss of 1.06%. Analyzing the memecoin’s price action revealed that while spot traders have been accumulating, derivatives traders have been focused on selling PEPE. Especially as short contracts rose across the market.
In fact, AMBCrypto’s analysis suggested that the market could go either way. Worth pointing out, however, that two technical indicators suggested that the bulls may overturn the bears and gain momentum.
A historic bearish confluence
A recent analysis of the Bollinger Bands on the daily chart revealed that the asset has been trading close to its upper band. This level is known to house major selling pressure, one that forces a decline in the altcoin’s value.
Historically, PEPE at this level has recorded major price drops, losing 49%, 28%, and 46% in the last three instances when the price hit this level.
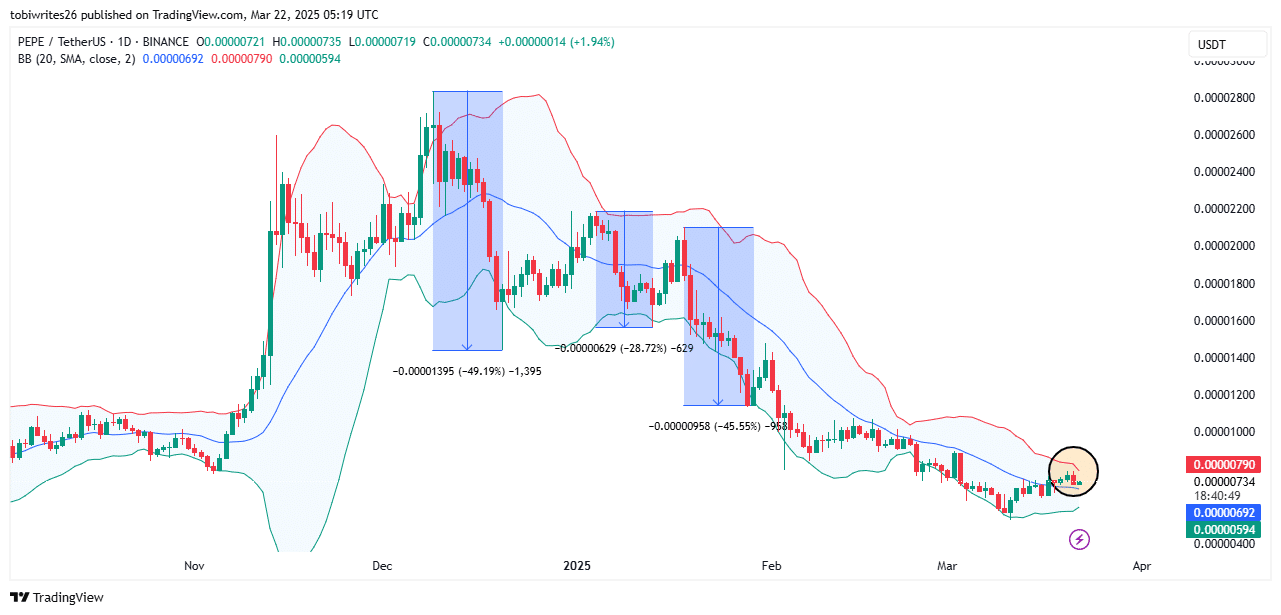
Source: TradingView
If this trend repeats itself, PEPE could see a significant decline, potentially leading to a double-digit percentage drop.
If this happens, the crypto-asset will return to trading below its descending line – A level it previously breached.
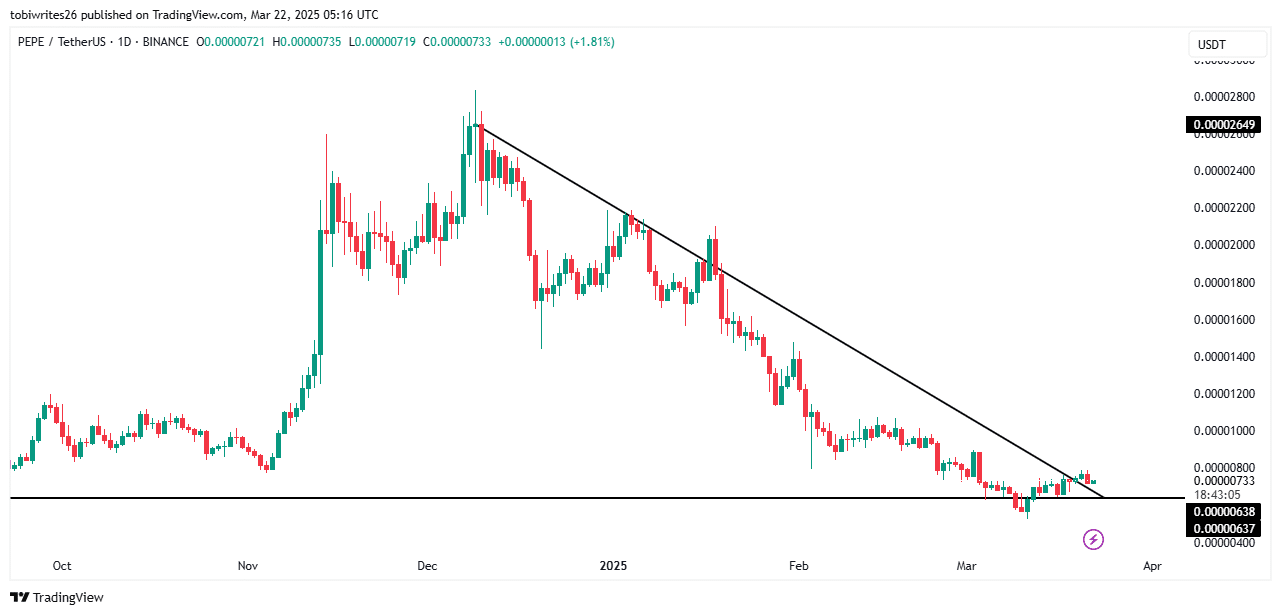
Source: TradingView
When the price crosses above this descending line, it typically signals the start of a rally and is followed by a high-momentum move. However, in this case, the price has been moving sluggishly, struggling to establish a rally. This indicated that a decline is, in fact, still possible.
AMBCrypto also found that derivatives and spot traders remain divided on the altcoin’s next price direction.
Derivative and spot traders remain on different pages
Over the last 24 hours, derivatives and spot traders have taken opposing positions on the price action front. While derivative traders have been betting on a price decline, spot traders have been accumulating, despite the dip.
In the derivatives market, Open Interest and Volume simultaneously fell by 1.65% and 39.46%, respectively. Such a drop means that the market is currently dominated by short traders and that momentum is weakening. At the time of writing, the value of unsettled contracts in the market stood at $233.96 million.
This downward pressure from derivatives short traders could play a significant role in keeping PEPE’s price low or driving it even lower.
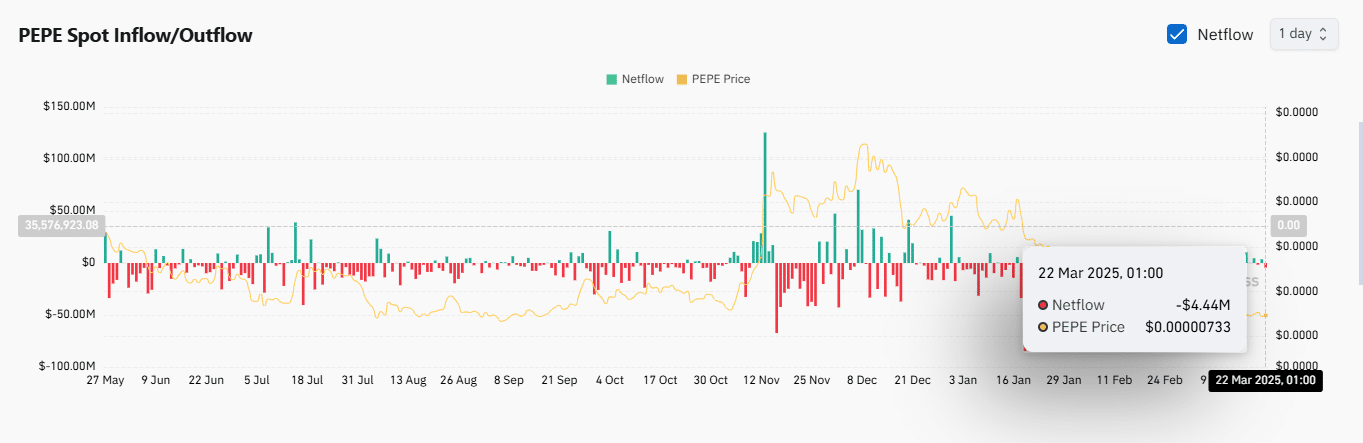
Source: Coinglass
However, spot traders are taking a different approach by accumulating PEPE. In the last 24 hours, this cohort has purchased $4.4 million worth of the asset, preventing further price depreciation.
A significant purchase from the spot market typically hints at strong bullish conviction. This could absorb selling pressure and lead to a price rebound on the charts.
Where is PEPE heading?
Finally, AMBCrypto analyzed other technical indicators to determine PEPE’s likely price action. Our analysts discovered ongoing accumulation and liquidity inflows into the asset – Suggesting a rally may be on the horizon.
The Accumulation/Distribution indicator’s reading was positive, with the same implying that the market has been in an accumulation phase.
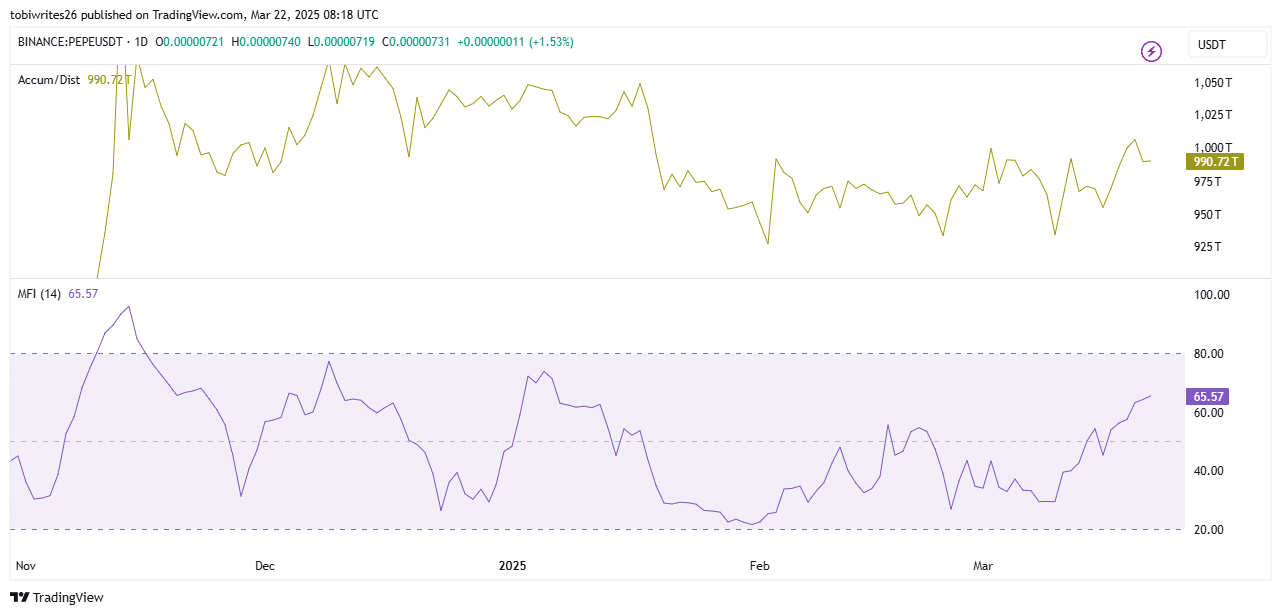
Source: TradingView
The Money Flow Index (MFI), which tracks liquidity inflows and outflows over a specific period, confirmed that liquidity is flowing into PEPE. Such inflows further confirmed the presence of buyers in the market.
At this juncture, PEPE could defy its historical bearish trend and establish a new high, particularly as spot traders continue accumulating.