- QNT’s breakout from its descending trendline and bullish indicators signaled potential gains to $229
- On-chain metrics and declining exchange reserves highlighted growing demand and reduced selling pressure
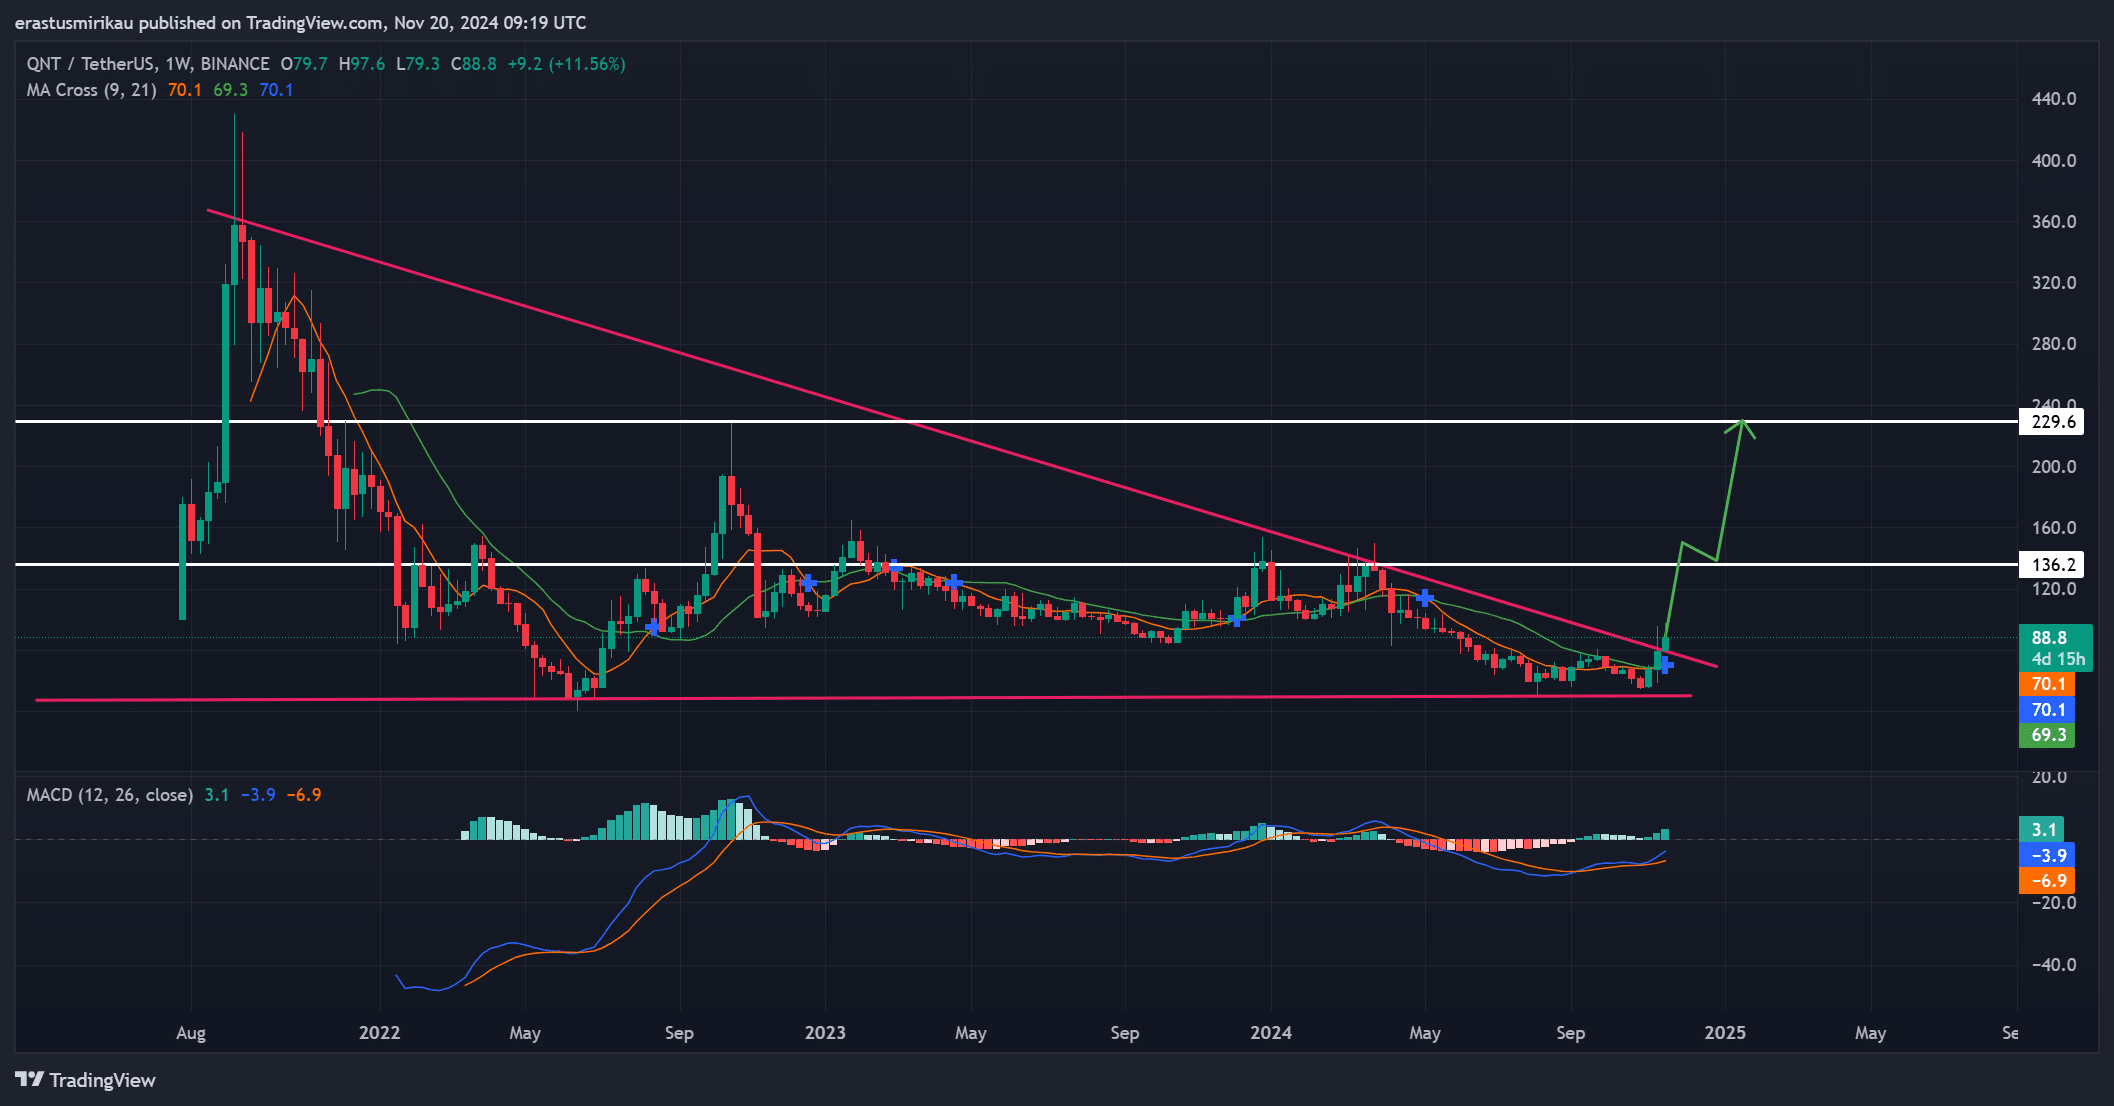
Quant [QNT] recently broke out of a long-term descending trendline on its weekly chart, igniting excitement among traders and analysts alike. The breakout pointed to a possible reversal of its months-long bearish trend, with QNT trading at $88.76 at press time – Up 0.81% in the last 24 hours.
However, the question remains – Can QNT sustain this momentum and hit new highs on the charts?
Technical analysis hints at bullish targets
QNT’s breakout from its descending channel marked a significant shift in sentiment. This technical development suggested that the cryptocurrency could aim for its first resistance at $136.2.
Additionally, if the rally gathers any momentum, QNT might surge towards the critical $229-level, offering significant upside potential.
Moreover, the Moving Average (MA) Cross highlighted growing bullish momentum, with the 9-week MA at $70.1 crossing above the 21-week MA at $69.3. This alignment typically is a sign of upward price movement.
Additionally, the MACD indicator further supported this outlook as the histogram turned positive with a press time reading of 3.1 – Indicating strengthening bullish momentum. These technical signals, combined, pointed to a potential rally towards the $136.2 and $229 key levels in the near term.

Source: TradingView
QNT’s bullish on-chain metrics add further confidence
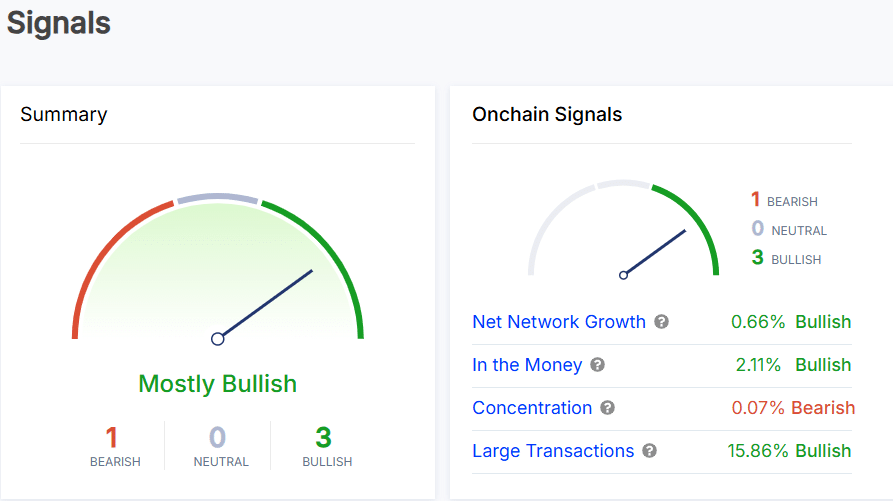
On-chain data provided more reasons for optimism. The Net Network Growth metric, for instance, hiked by 0.66%, reflecting a rise in new users and activity on the Quant network. Furthermore, the “In the Money” metric indicated that 2.11% of QNT holders were in profit – A sign of stronger investor sentiment.
Additionally, large transactions surged by 15.86%, signaling greater involvement from high net-worth individuals or institutions. Although concentration among large holders revealed minimal bearish influence, the larger on-chain picture seemed heavily skewed towards bullish activity.
To put it simply, QNT’s on-chain performance seemed well in line with its bullish technical breakout.


Source: IntoTheBlock
QNT exchange reserves point to lower selling pressure
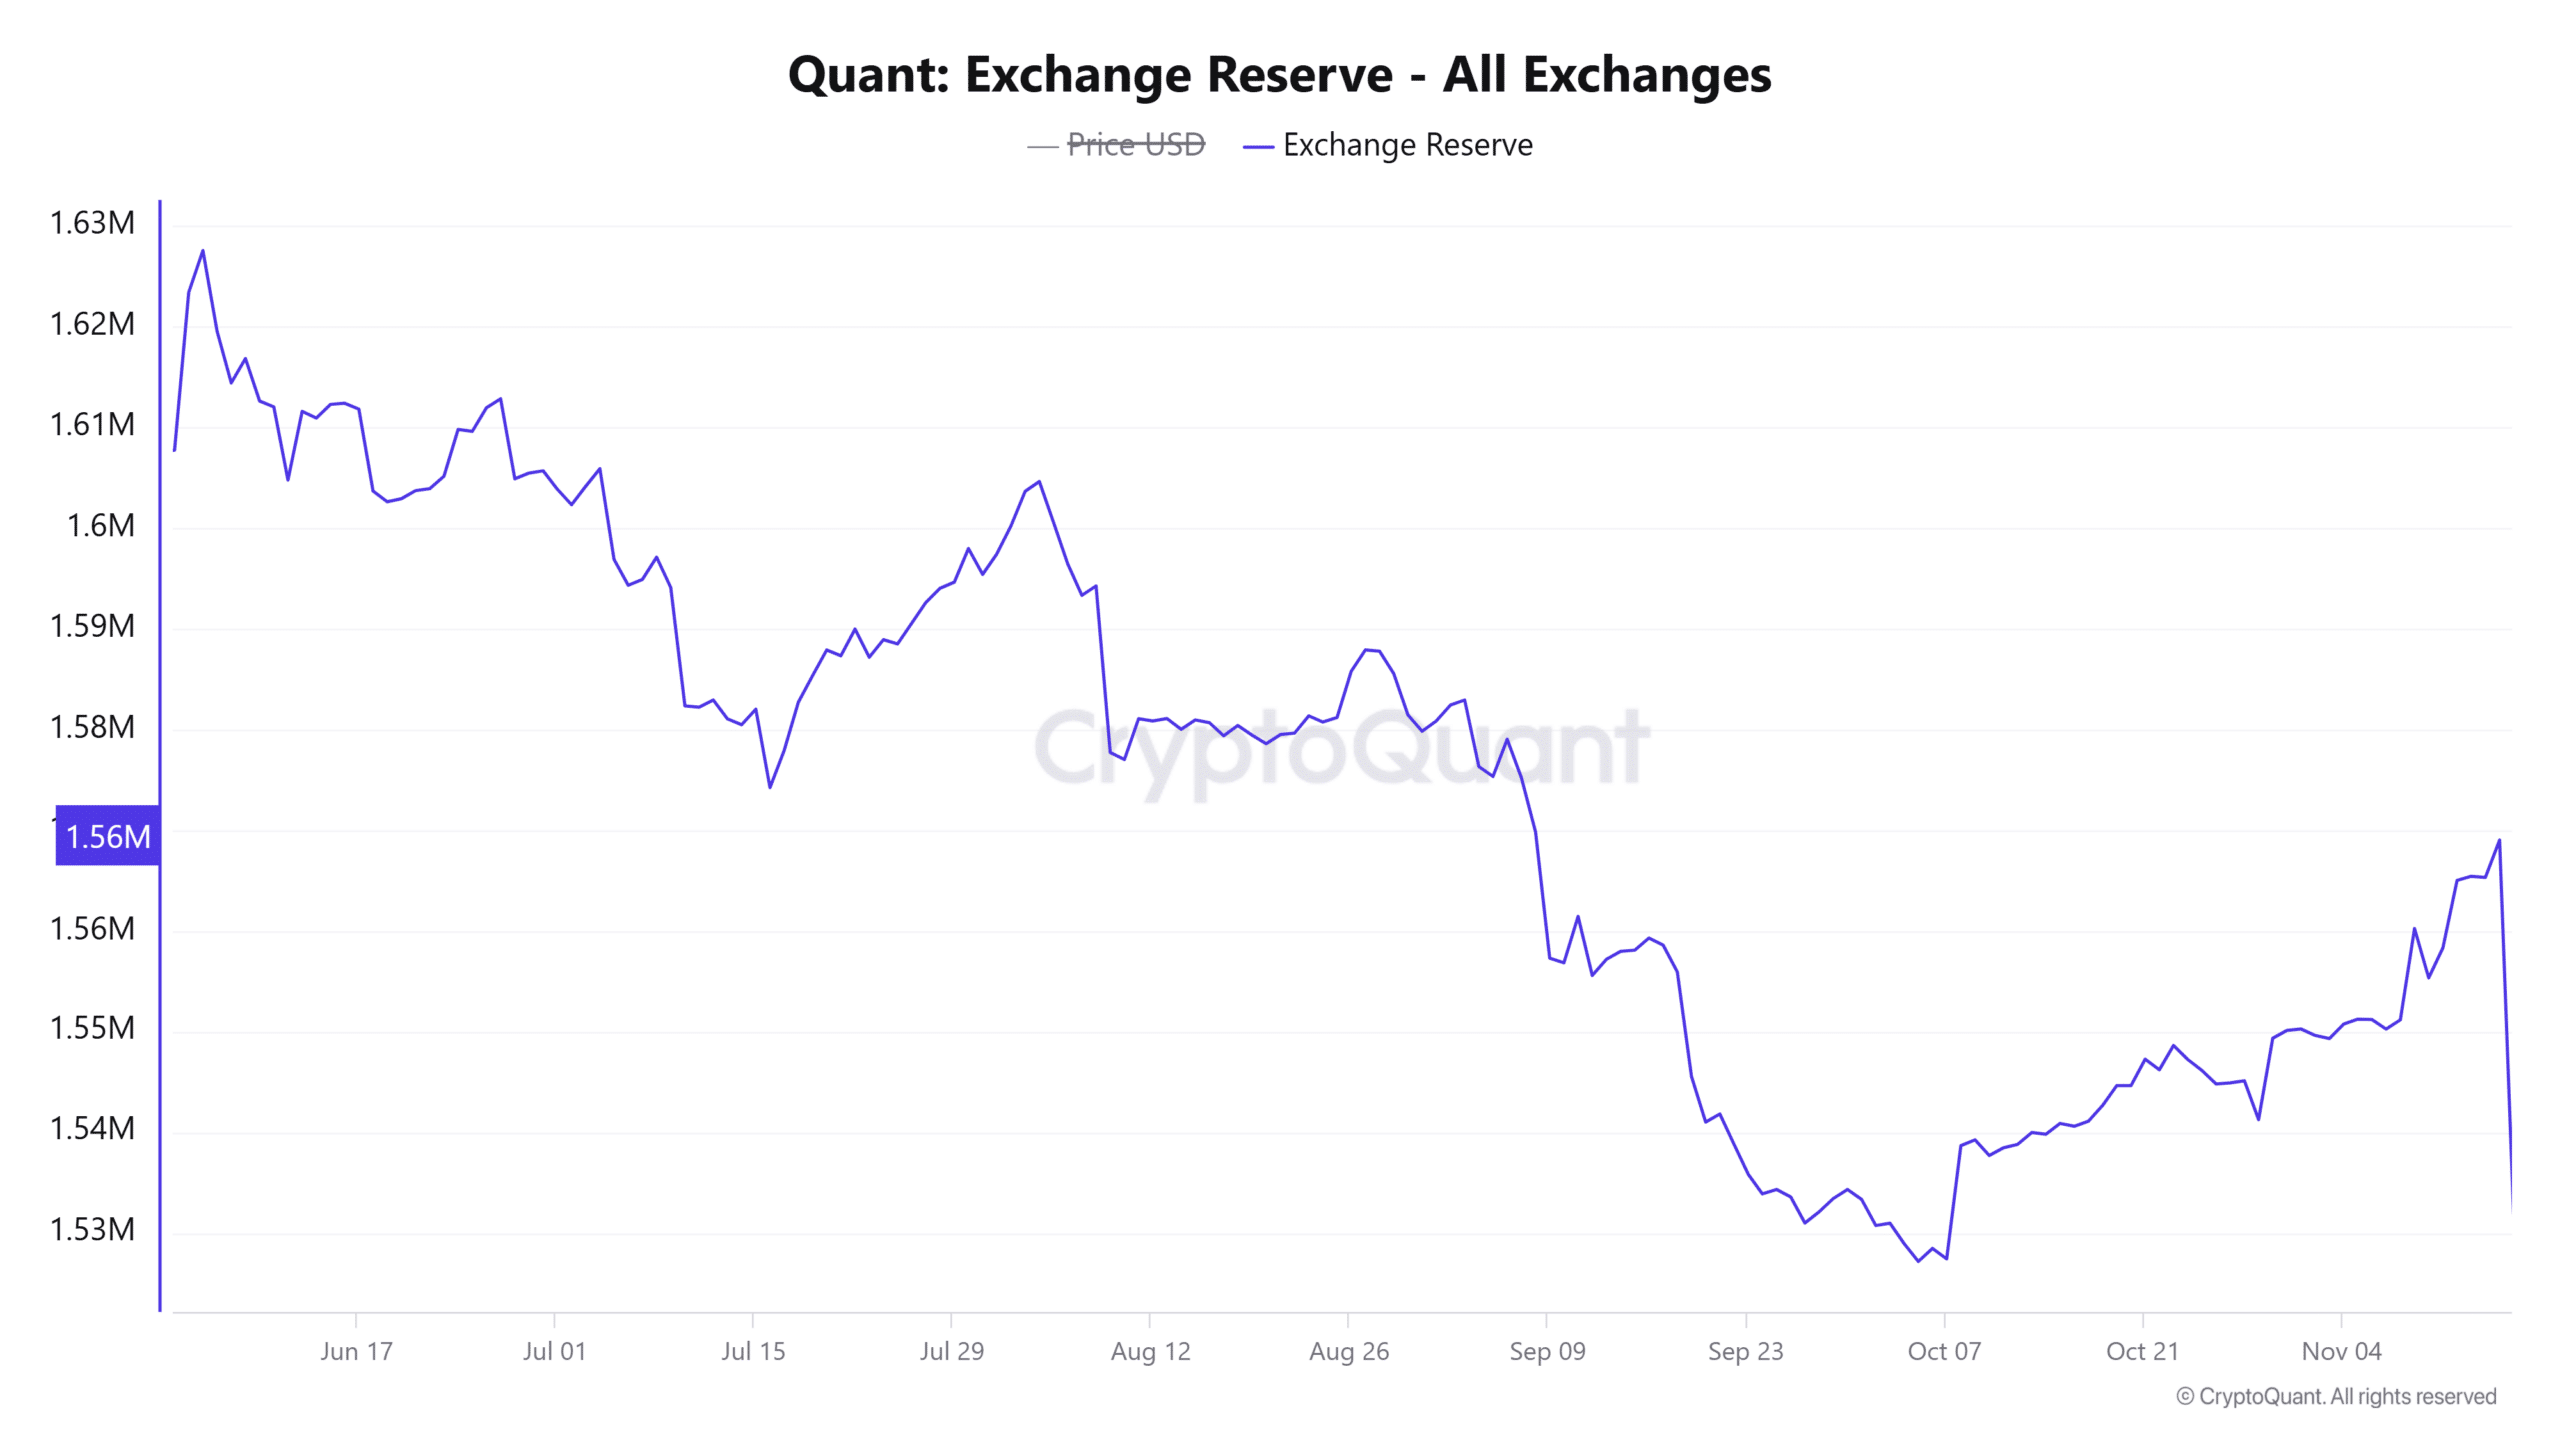
Quant’s declining exchange reserves projected figures of 1.526 million at press time, following a 0.07% drop in the last 24 hours.
A fall in exchange reserves often means reduced selling pressure as investors transfer their holdings to long-term storage. This could precipitate a supply squeeze, further supporting upward price movement.


Source: CryptoQuant
Read Quant’s [QNT] Price Prediction 2024–2025
QNT’s breakout above its descending trendline, coupled with bullish technical indicators and robust on-chain metrics, suggested that the cryptocurrency may be poised for further gains.
If it successfully clears the $136 resistance level, a move towards $229 may be highly plausible. Therefore, all signs pointed to QNT potentially entering a major bullish phase, making it a token to watch in the near term.

