
- Solana revisited $145, causing a cascade of liquidations in the market
- High liquidity at $150 could drive the price up on the charts
AMBCrypto found that Solana [SOL] positions worth $9.14 million have been liquidated in the last 24 hours. Out of this figure, long positions accounted for $2.37 million while shorts took more of the hit, with $6.77 million liquidated.
Liquidation occurs when a trader’s balance is insufficient to keep a trade open. This leads to a partial or total loss of the initial margin. In some cases, the event happens because of high leverage, extreme volatility, or a failed bet.
For those unfamiliar, longs are traders betting on the price of an asset to increase. Shorts, on the other hand, are those predicting a decline.
AMBCrypto’s investigation revealed that the liquidations occurred because of SOL’s price action. Like other cryptocurrencies in the market, SOL tumbled on 2 May, leading traders to assume that the price might continue to slip on the charts.
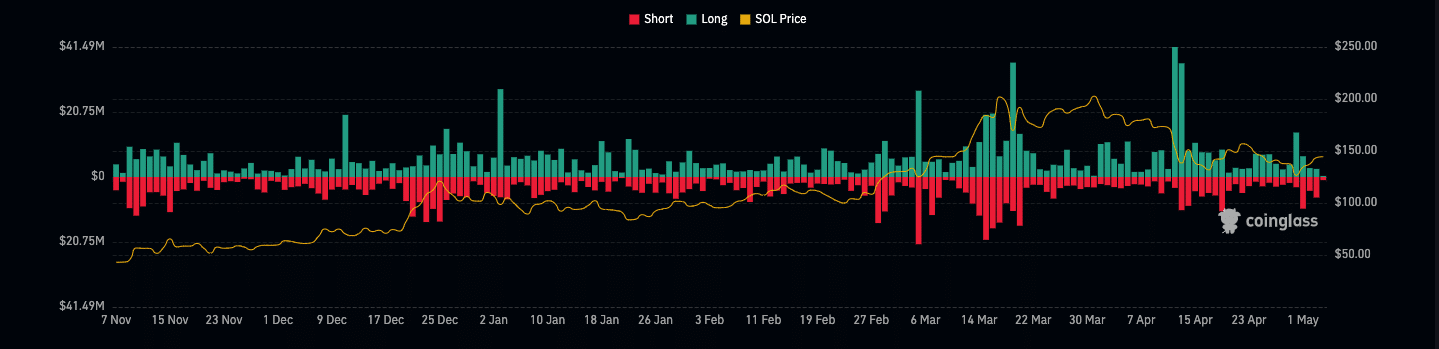
Source: Coinglass
No giving up on the forecast?
However, the token had other plans as it rose to $145.08 two days later. In fact, SOL’s price appreciated by almost 5% in the last 24 hours. Should the price continue to rise, more positions, especially on the short side, could be wiped out.
However, liquidations did not deter traders from taking a break. This was evidenced by the Open Interest (OI). According to data from Santiment, SOL’s OI rose to $1.45 billion. An increase in OI implies that new money is flowing into the market. When the OI hikes, it means that traders are increasingly closing their positions.
The OI hike could fuel the direction the crypto takes next. Hence, the price of SOL might keep moving north in the short term.
However, it is important to note that OI might not be large enough to set off a rally. As such, SOL might change hands within a tight trading range of $145 and $150.
Furthermore, AMBCrypto observed one interesting thing from the Funding Rate. For context, a positive Funding Rate implies that the perp price of an asset is trading at a premium. Here, longs pay a funding fee to shorts.
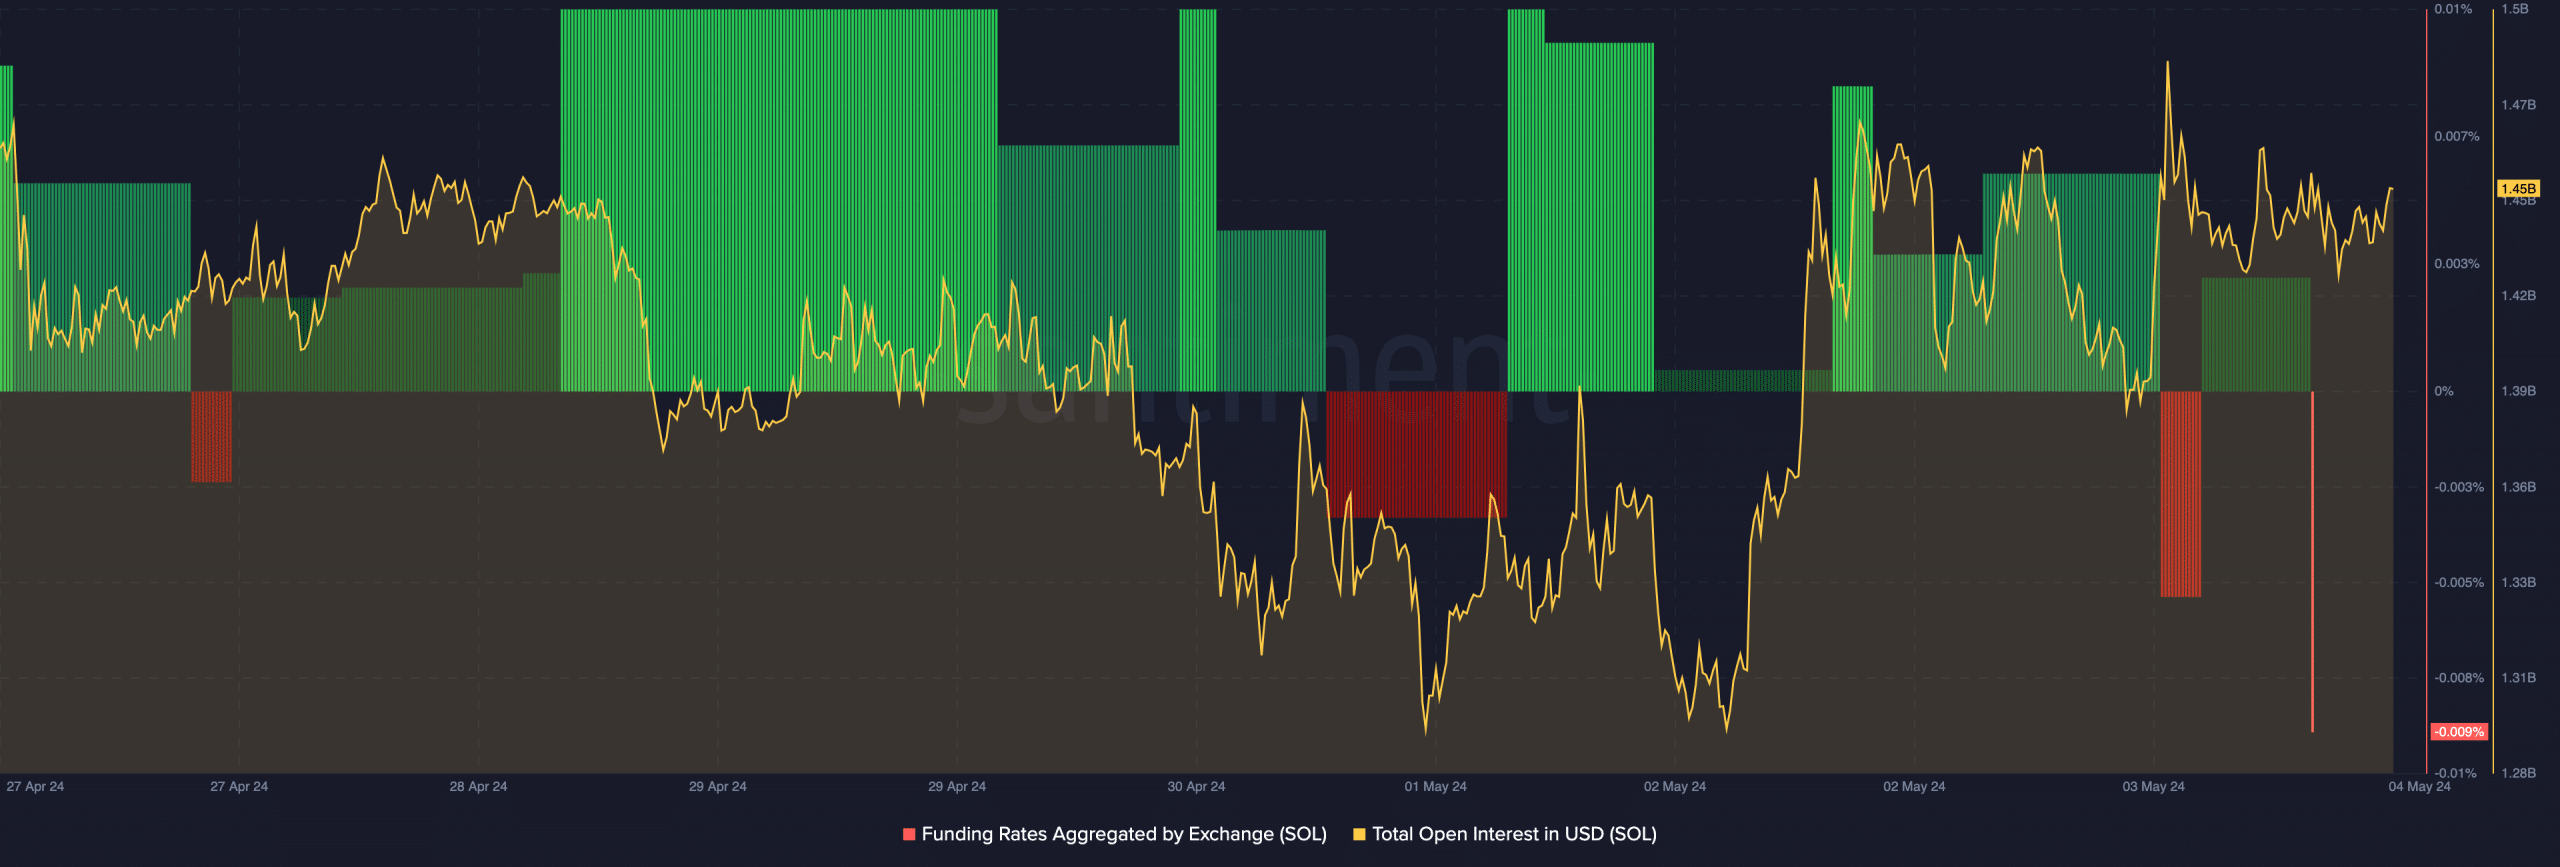
Source: Santiment
Conversely, a negative reading suggests that the perp price is trading at a discount. At the time of writing, SOL’s Funding Rate was -0..009% on the charts.
SOL to $160 looks possible
This high negative reading implies that shorts have been aggressive. However, the token’s rising price revealed that they are not being rewarded. Should the metrics remain this way, SOL might reinforce its bullish potential and the shorts might face another round of liquidations.
Additionally, we also looked at the liquidation heatmap which identifies high areas of liquidity. This indicator also tells traders the possible direction the price might move in.
Based on Hyblock’s data, it can be seen that there was high liquidity at $150, $160.80, and $178.47 (all coloured yellow) This implies that SOL’s price might move toward these zones.
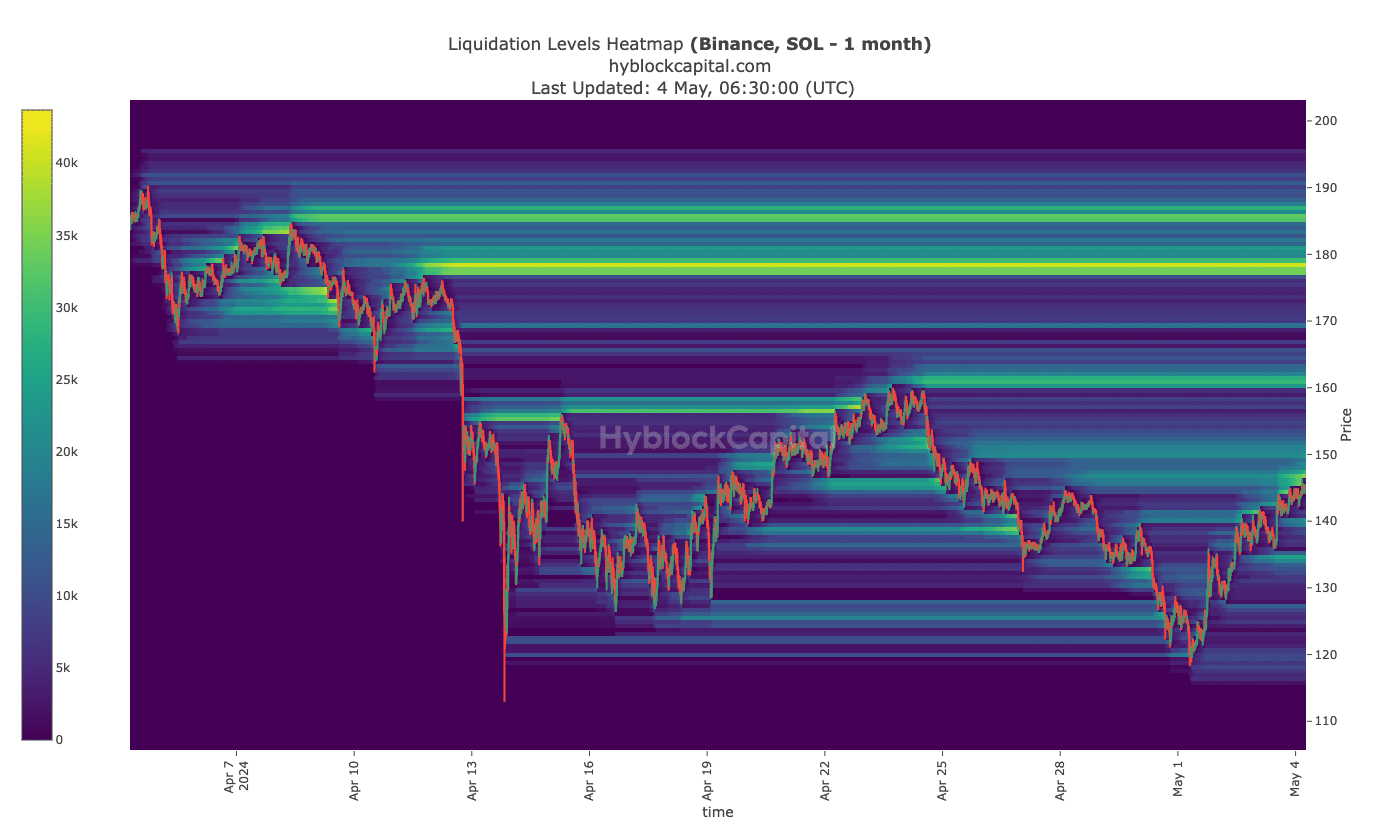
Source: Hyblock
Read Solana’s [SOL] Price Prediction 2024-2025
If the altcoin’s price continues to hike, the first target would be $150. At this point. it could face some resistance.
However, a successful breach of this region could trigger a jump toward $160, and this could be a reasonable short-term price.