
- MEW’s price has surged by more than 200% since its launch.
- Sentiment around BOME was bearish, while MEW’s metrics looked bullish.
The memecoin frenzy shows no signs of slowing down, with a wave of fresh cryptos flooding the market. Among them, stands the quirky newcomer: Cat in a dogs world [MEW].
Solana-based memecoin MEW came into the limelight as it managed to outshine Book of MEME [BOME]. However, BOME was quick to reclaim its position at press time.
MEW’s robust growth
It has been only a month since MEW launched, and within the short period it has displayed explosive growth. According to CoinMarketCap, the newly launched memecoin’s value surged by more than 200% in the last 30 days.
The massive price rise allowed MEW to quickly become a mainstream memecoin.
In fact, as per a recent tweet from SolanaFloor, MEW managed to flip BOME in terms of market capitalization.
However, the trend didn’t last long as BOME swiftly increased its market cap and overtook MEW. The reason behind this was the high volatility in the market.
On one hand BOME’s price surged by nearly 4% in the last 24 hours and on the other, MEW’s price only increased by 1% during the same period.
At press time, BOME was trading at $0.01077, making it the 122nd largest crypto. MEW was valued at $0.005876.
Though BOME took the lead, the difference between these two memecoins’s market caps was just $70 million. Therefore, AMBCrypto delved deeper into their metrics to see whether MEW can outshine BOME in the coming days.
BOME vs MEW
AMBCrypto’s analysis of Santiment’s data revealed that both MEW and BOME’s social volumes remained comparable throughout the last week.
However, market sentiment around them was different. MEW’s weighted sentiment registered a spike on the 25th of April, suggesting that bullish sentiment around it increased.
The case with BOME was different as its weighted sentiment remained in the negative zone, which meant that bearish sentiment around it was dominant in the market.
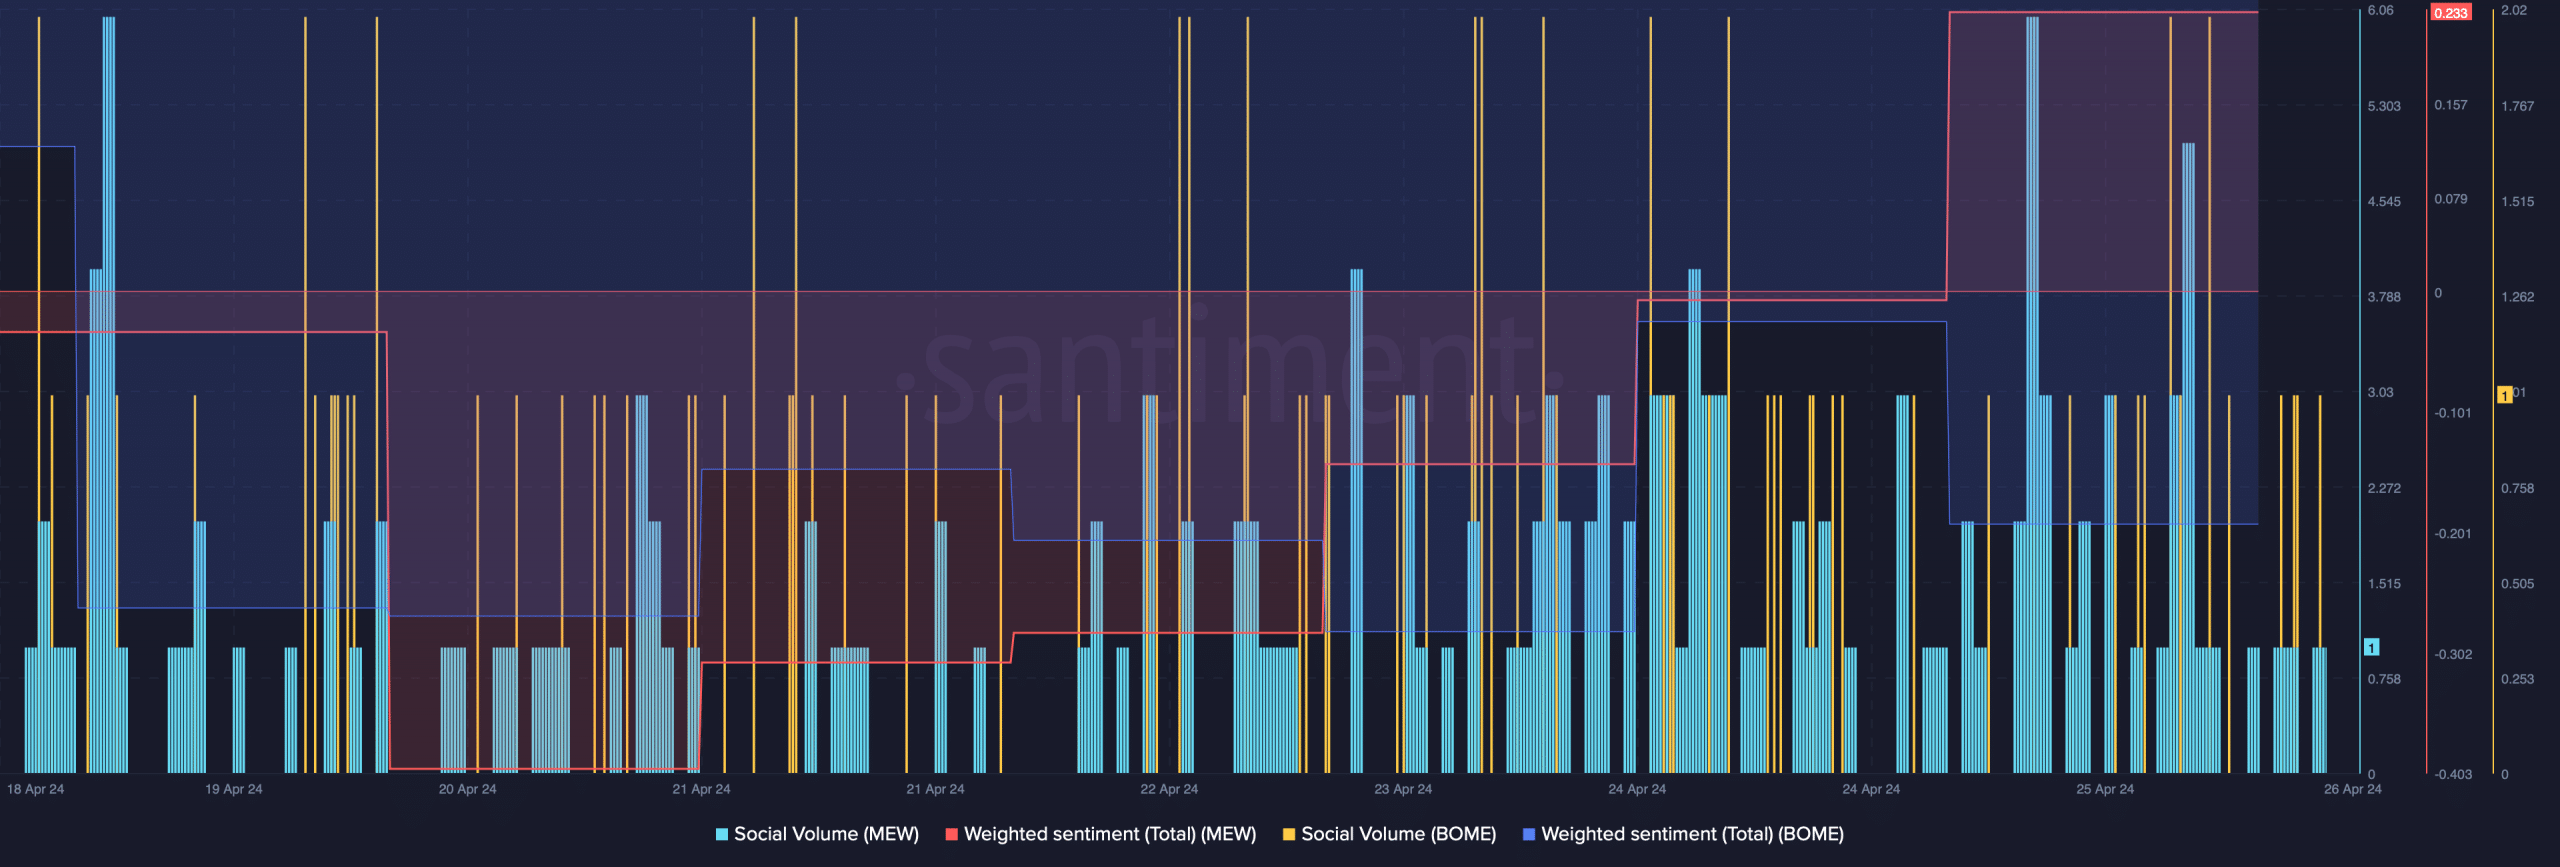
Source: Santiment
We then analyzed both meme coins daily charts to understand which way they were headed. We found that BOME’s MACD displayed a bullish advantage in the market, hinting at a continued price rise.
However, its Relative Strength Index (RSI) was resting below the neutral mark. This suggested that its bull rally might end soon, giving MEW an opportunity to go above BOME.
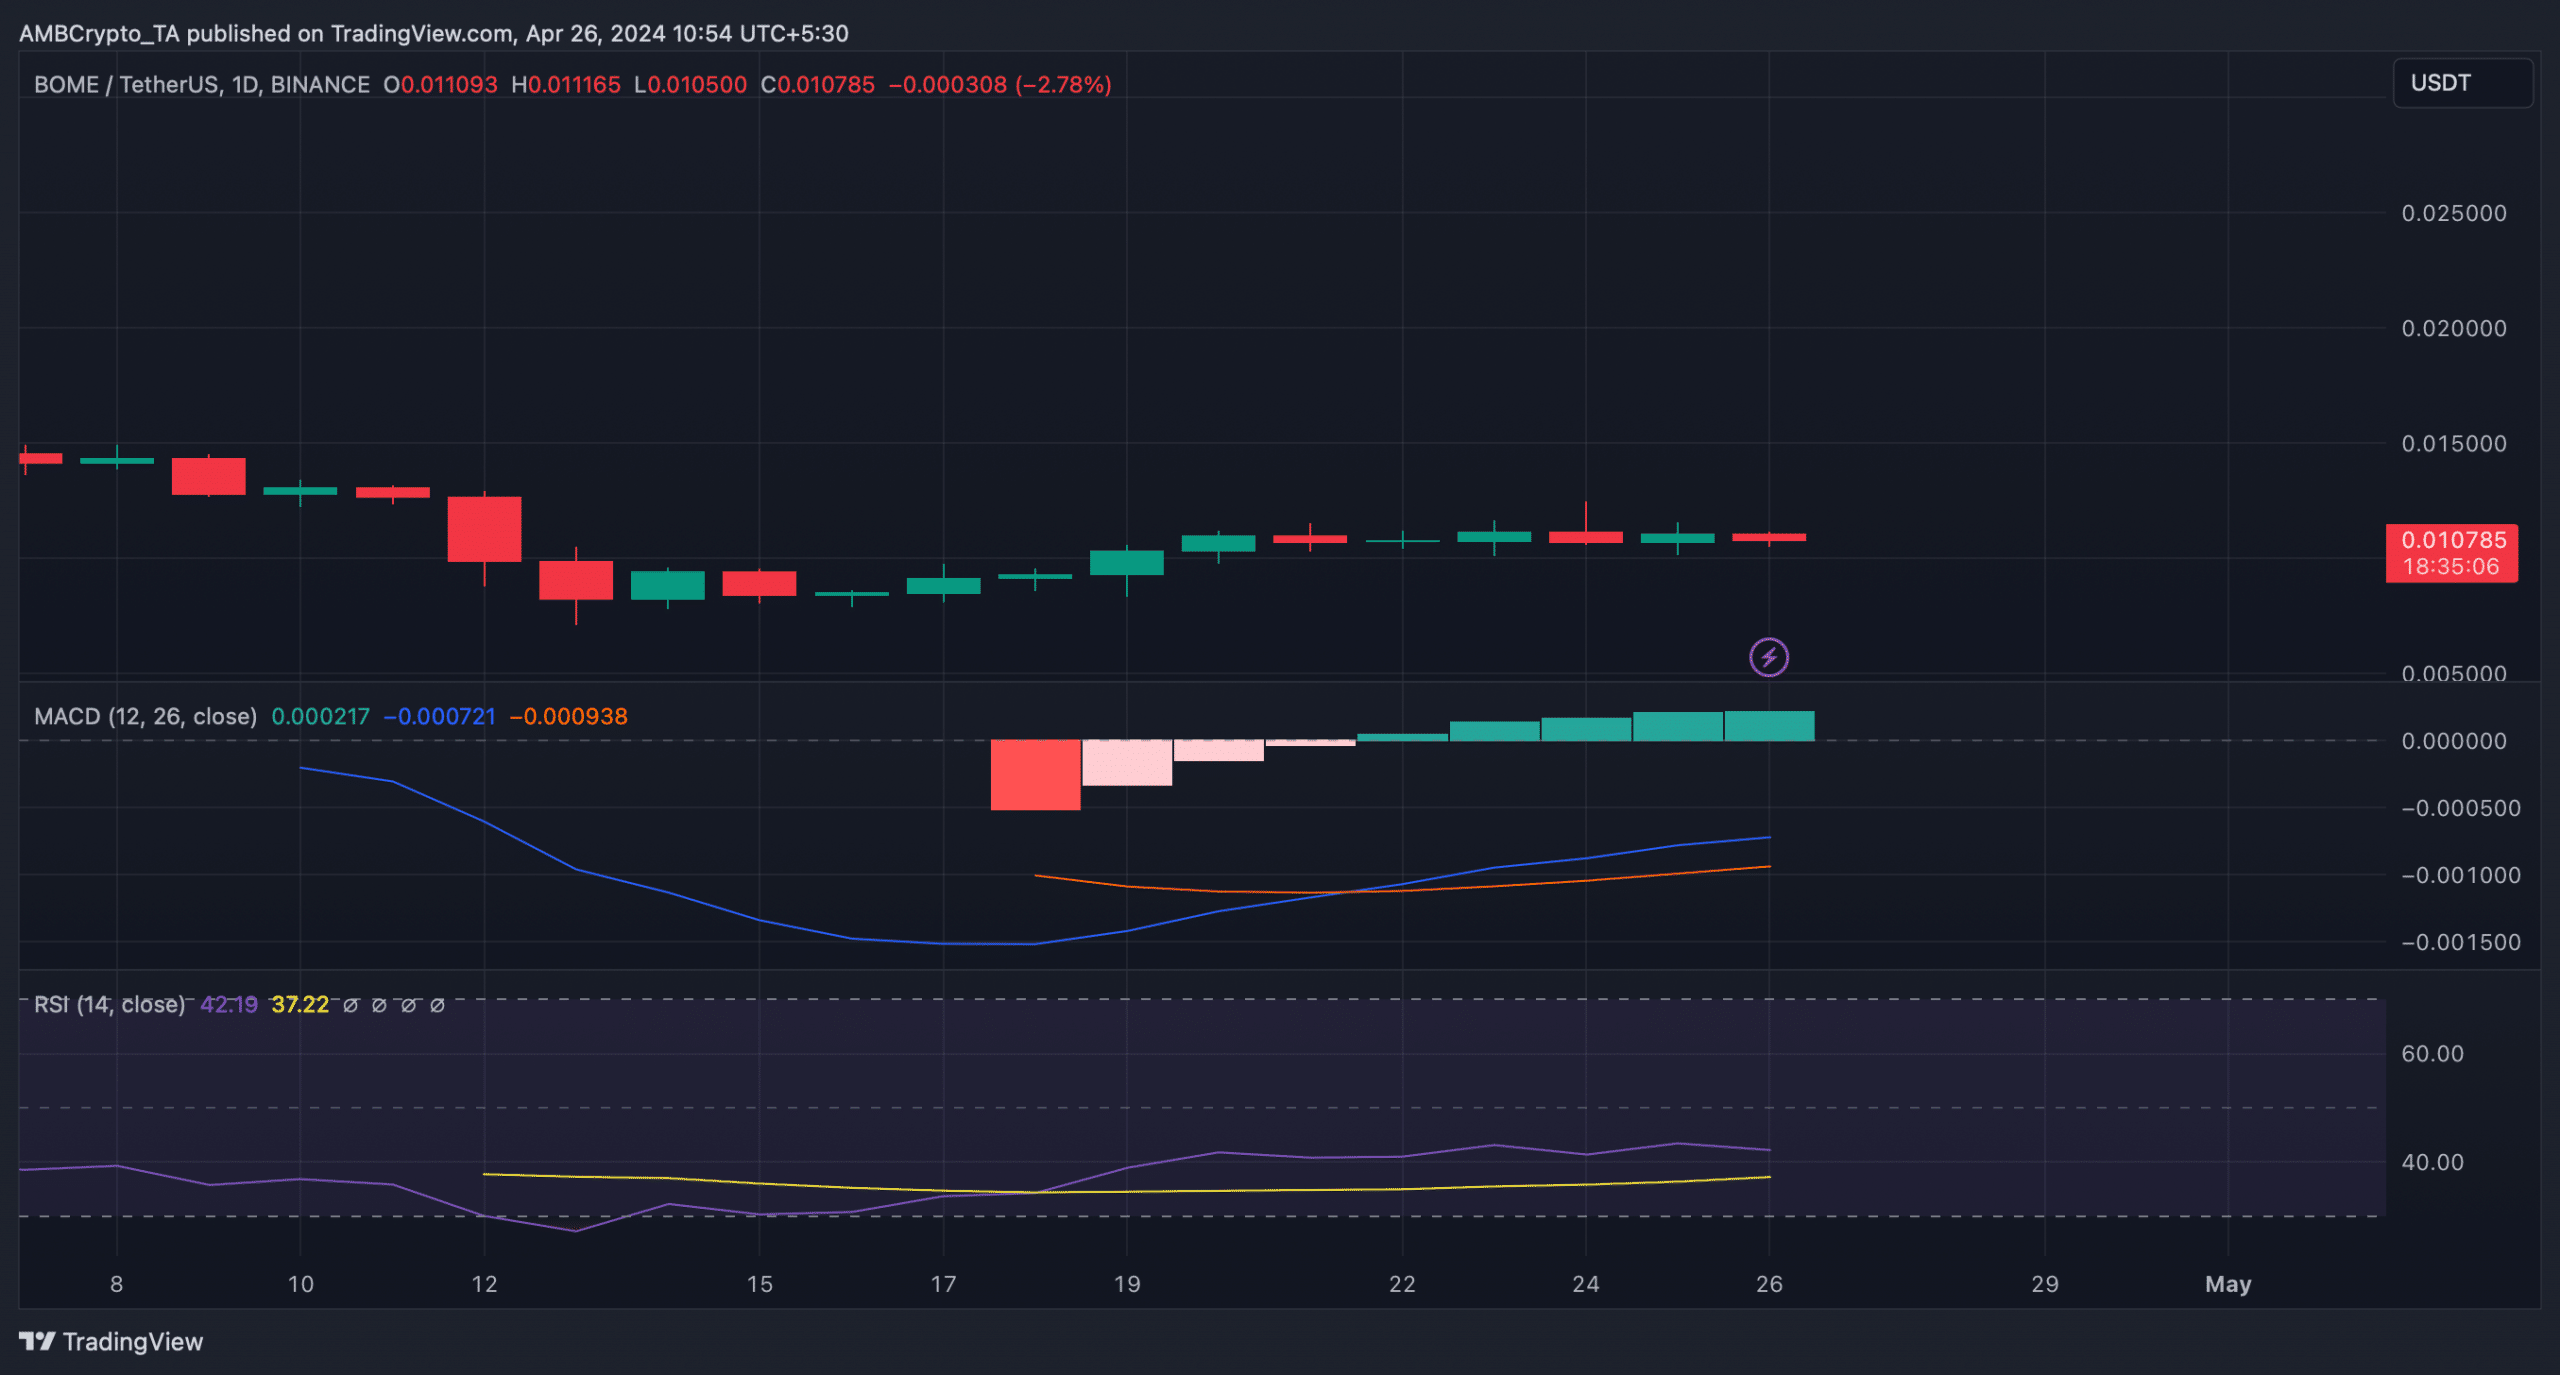
Source: TradingView
Realistic or not, here’s BOME market cap in BTC’s terms
MEW’s price was resting above its 20-day Simple Moving Average (SMA), as pointed out by the Bollinger Bands. Its Money Flow Index (MFI) was also above the neutral mark, indicating that the chances of a price increase are high in the coming days.
But the Chaikin Money Flow (CMF) looked bearish as it registered a sharp downtick.
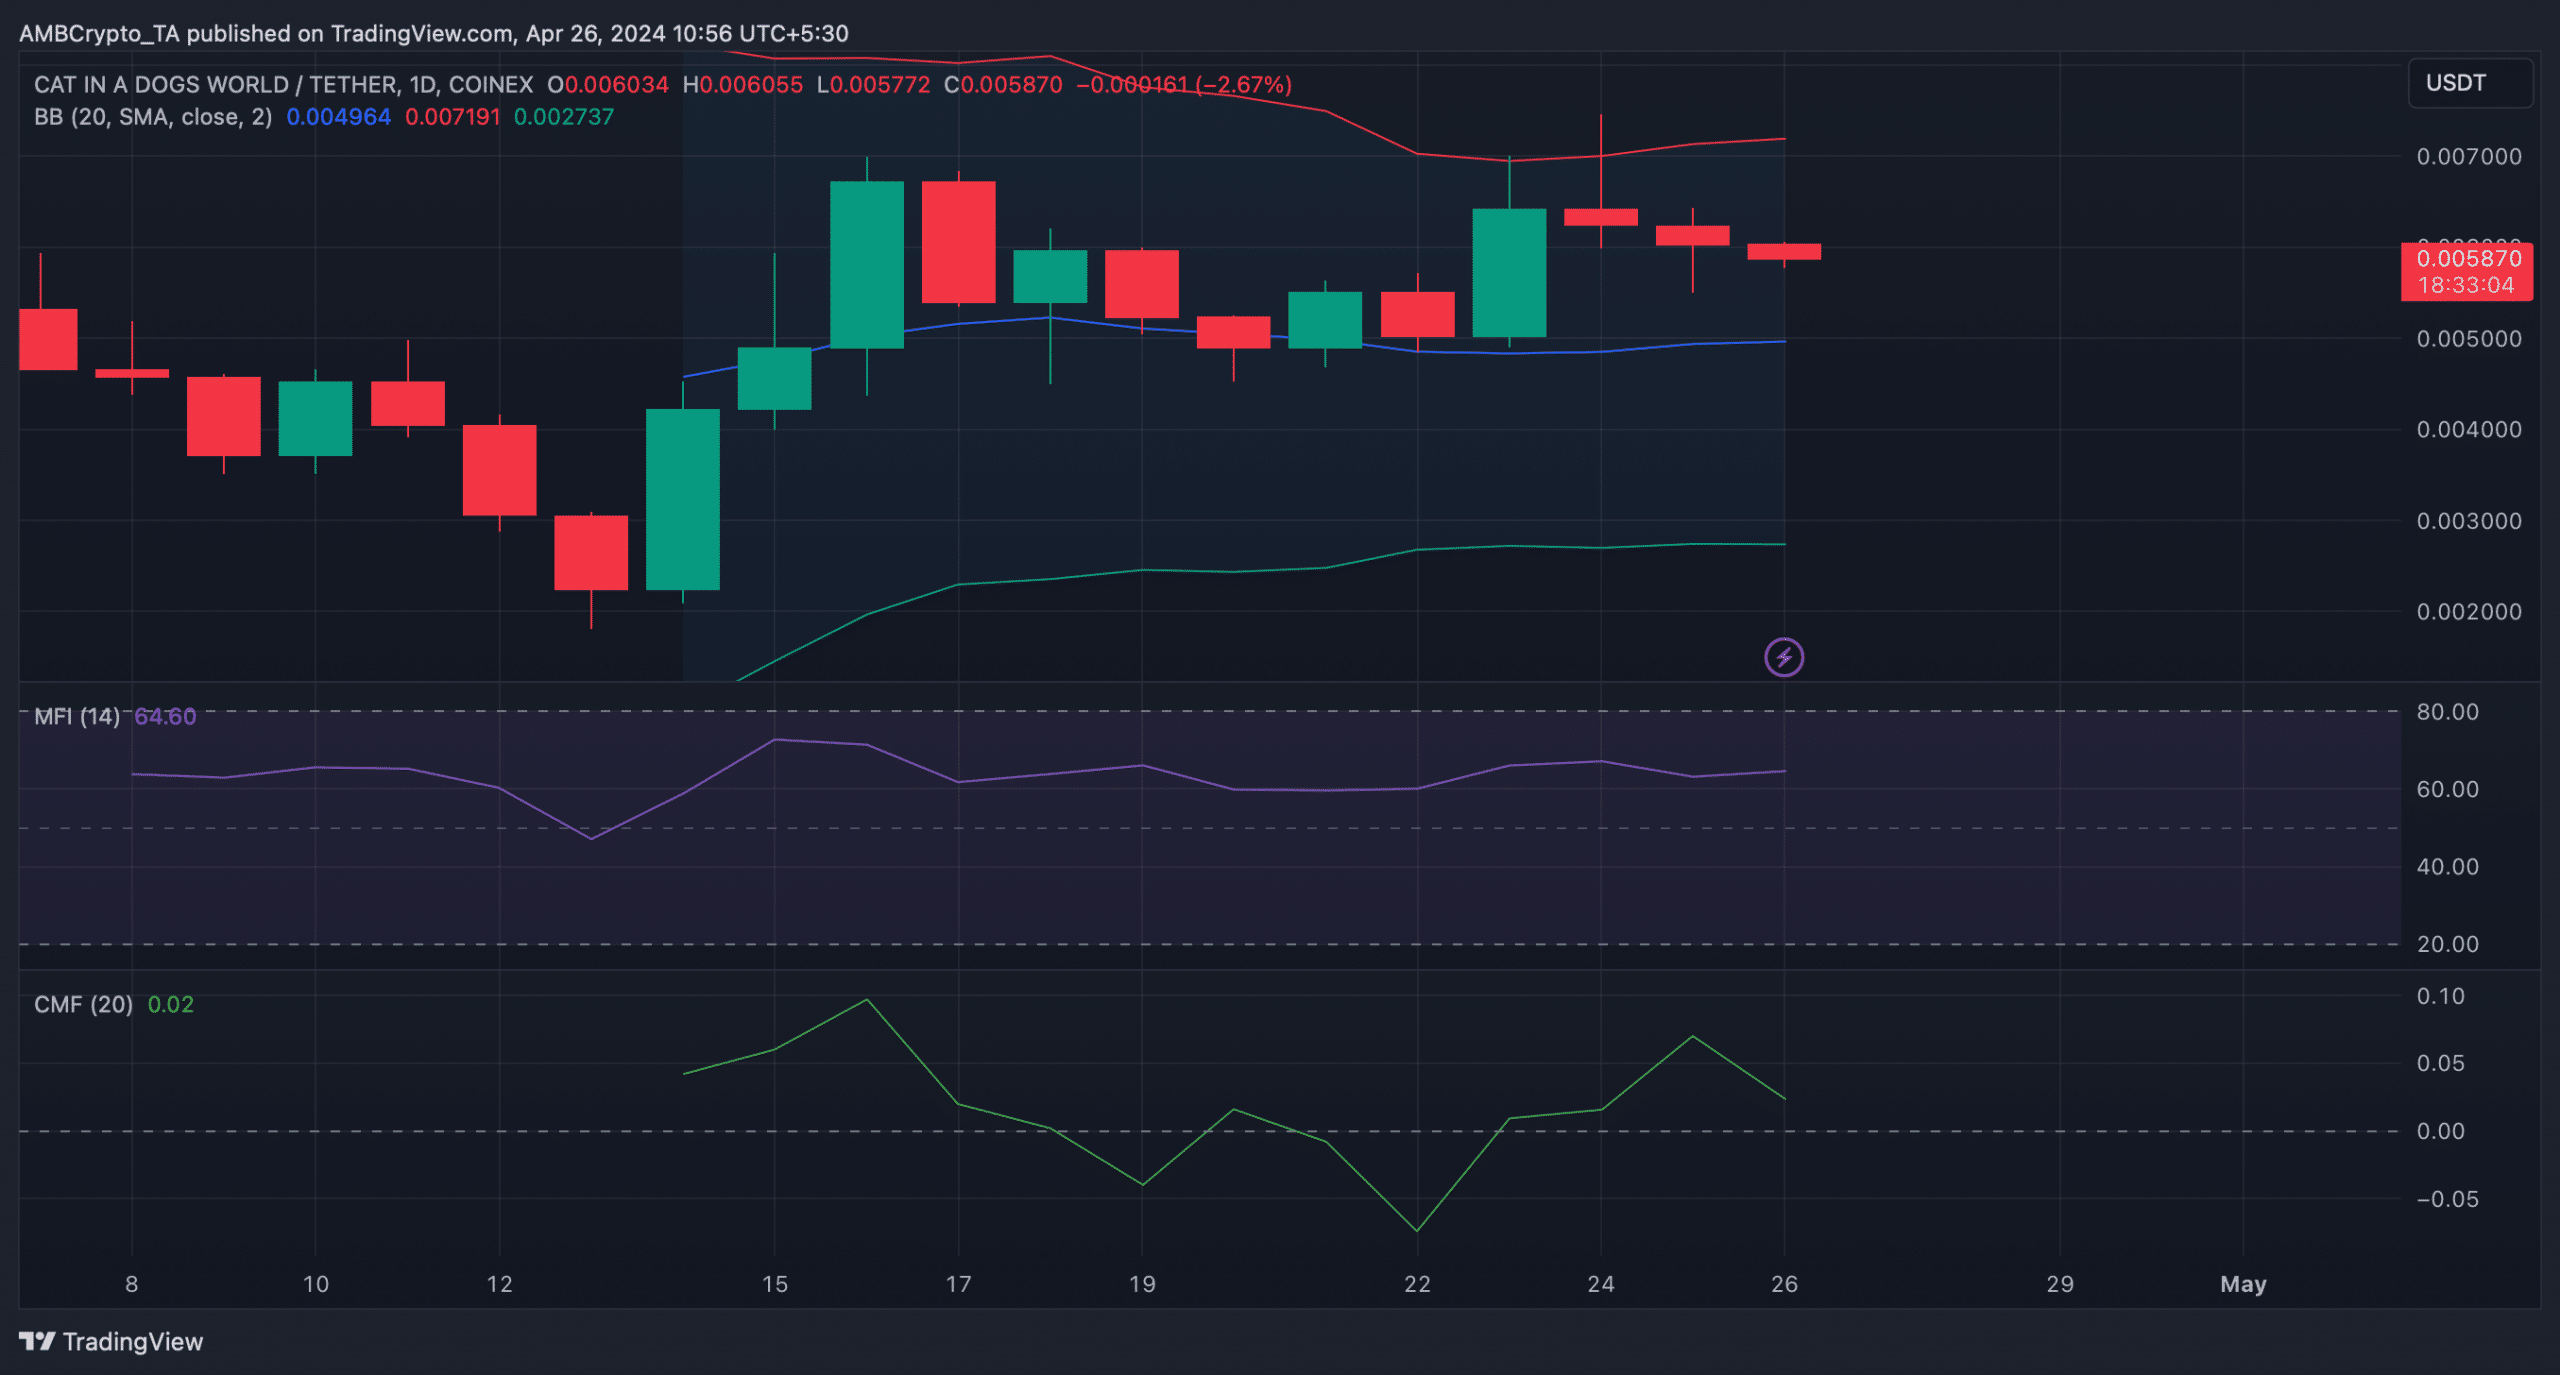
Source: TradingView