- Toncoin has broken out of a bullish pennant, with $6.03 resistance now in focus.
- Market sentiment has realigned favorably, supported by MACD signals and strong on-chain metrics.
Toncoin [TON] has finally broken free from its prolonged consolidation, signaling the beginning of a new bullish chapter.
Trading at $5.52 with a 3.22% increase at press time, TON appeared poised for a significant upward rally.
The critical question is, can TON sustain its momentum, break past $6.03, and reach the ambitious target of $8.30?
Breaking out of the bullish pennant
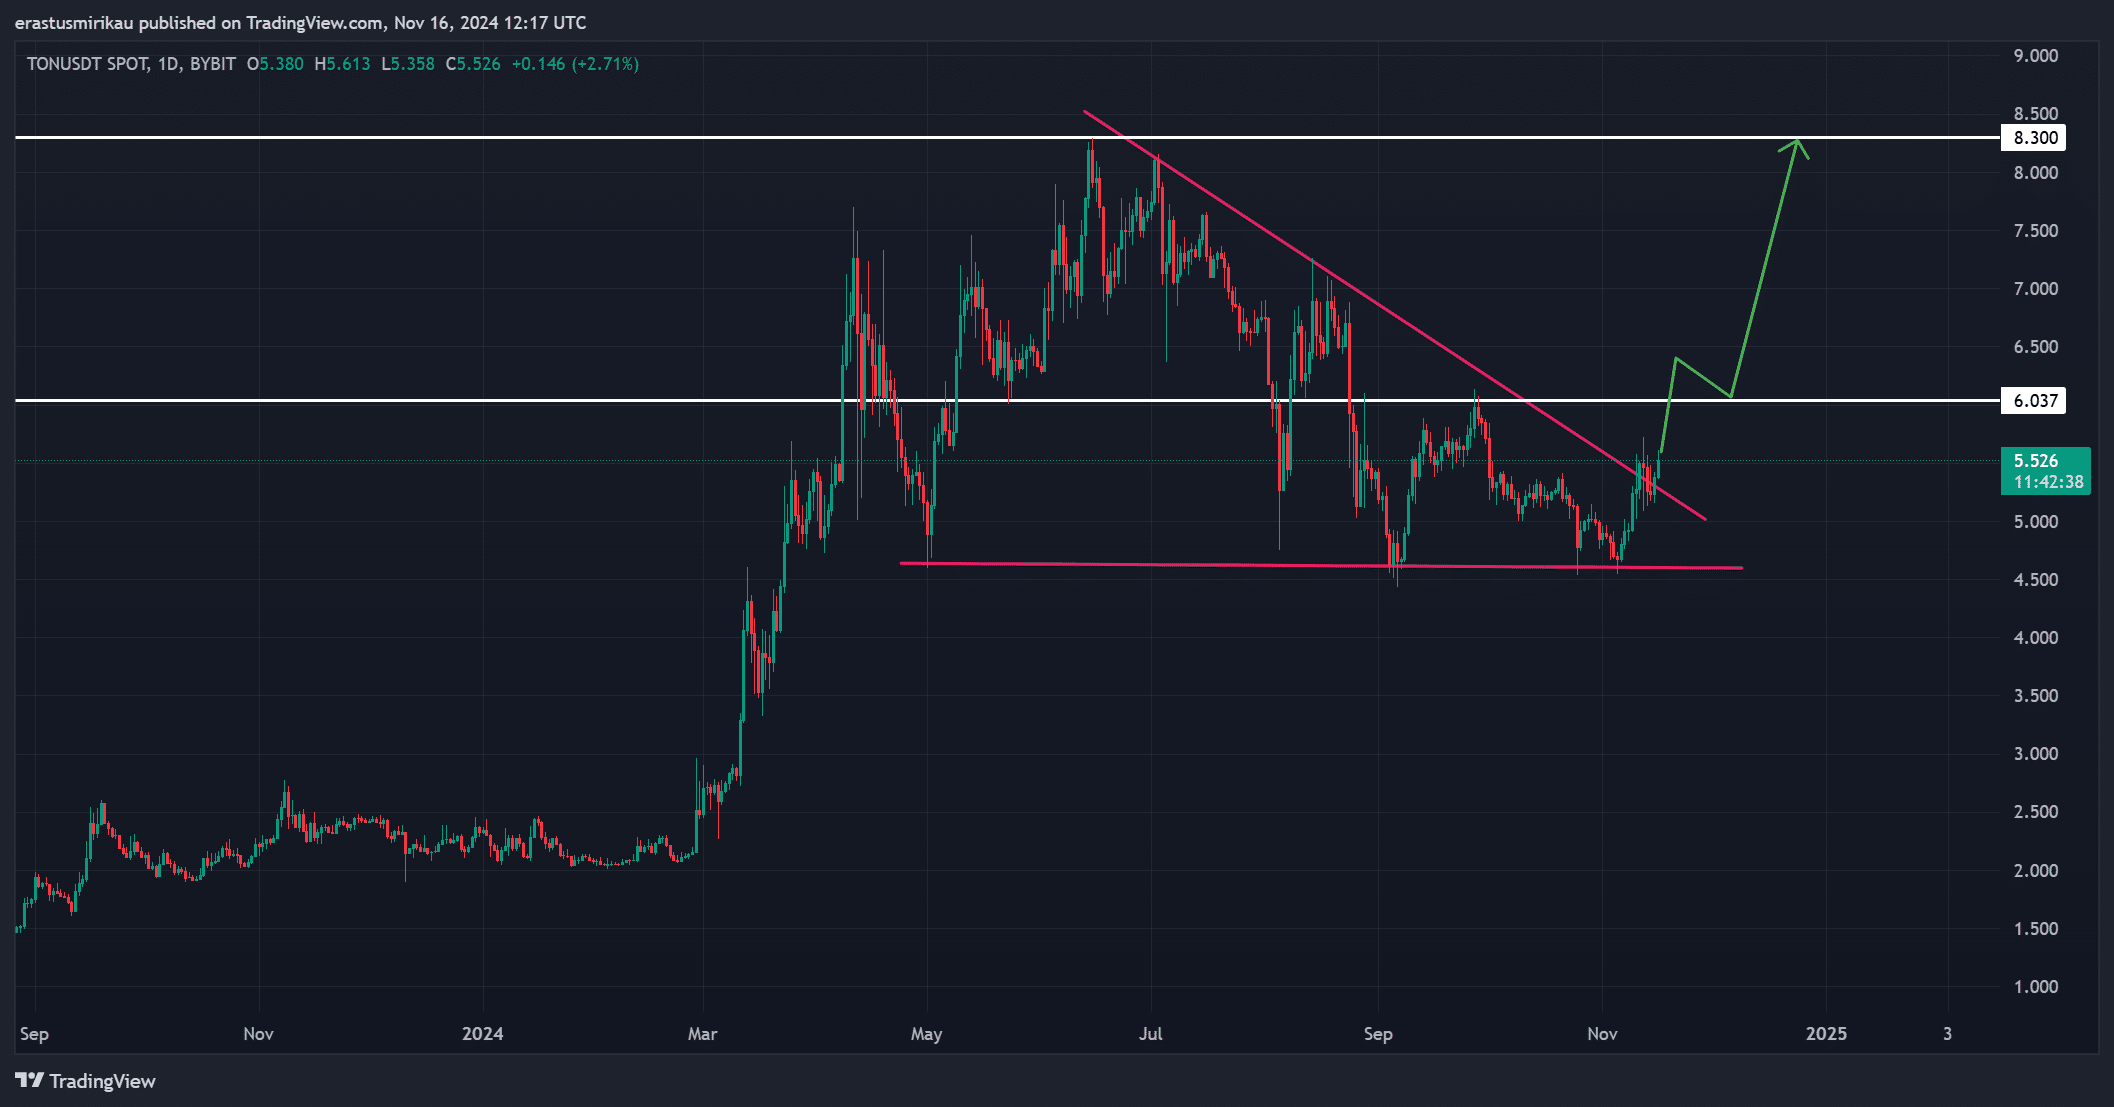
TON’s recent breakout from its bullish pennant pattern is a pivotal move, solidifying its bullish outlook.
This breakout was validated by a successful retest of the pattern’s lower boundary, which provided the springboard for the current rally.
The $6.03 resistance remained the immediate hurdle, as this level has previously capped TON’s upward movements.
If TON manages to decisively break above $6.03, it could open the doors to higher targets, including $8.30, which aligns with historical price action and key Fibonacci levels.
Conversely, failure to clear $6.03 might lead to a pullback toward the $5.00-$4.50 support zone. Therefore, traders are closely monitoring TON’s next move.

Source: TradingView
TON’s rowing momentum
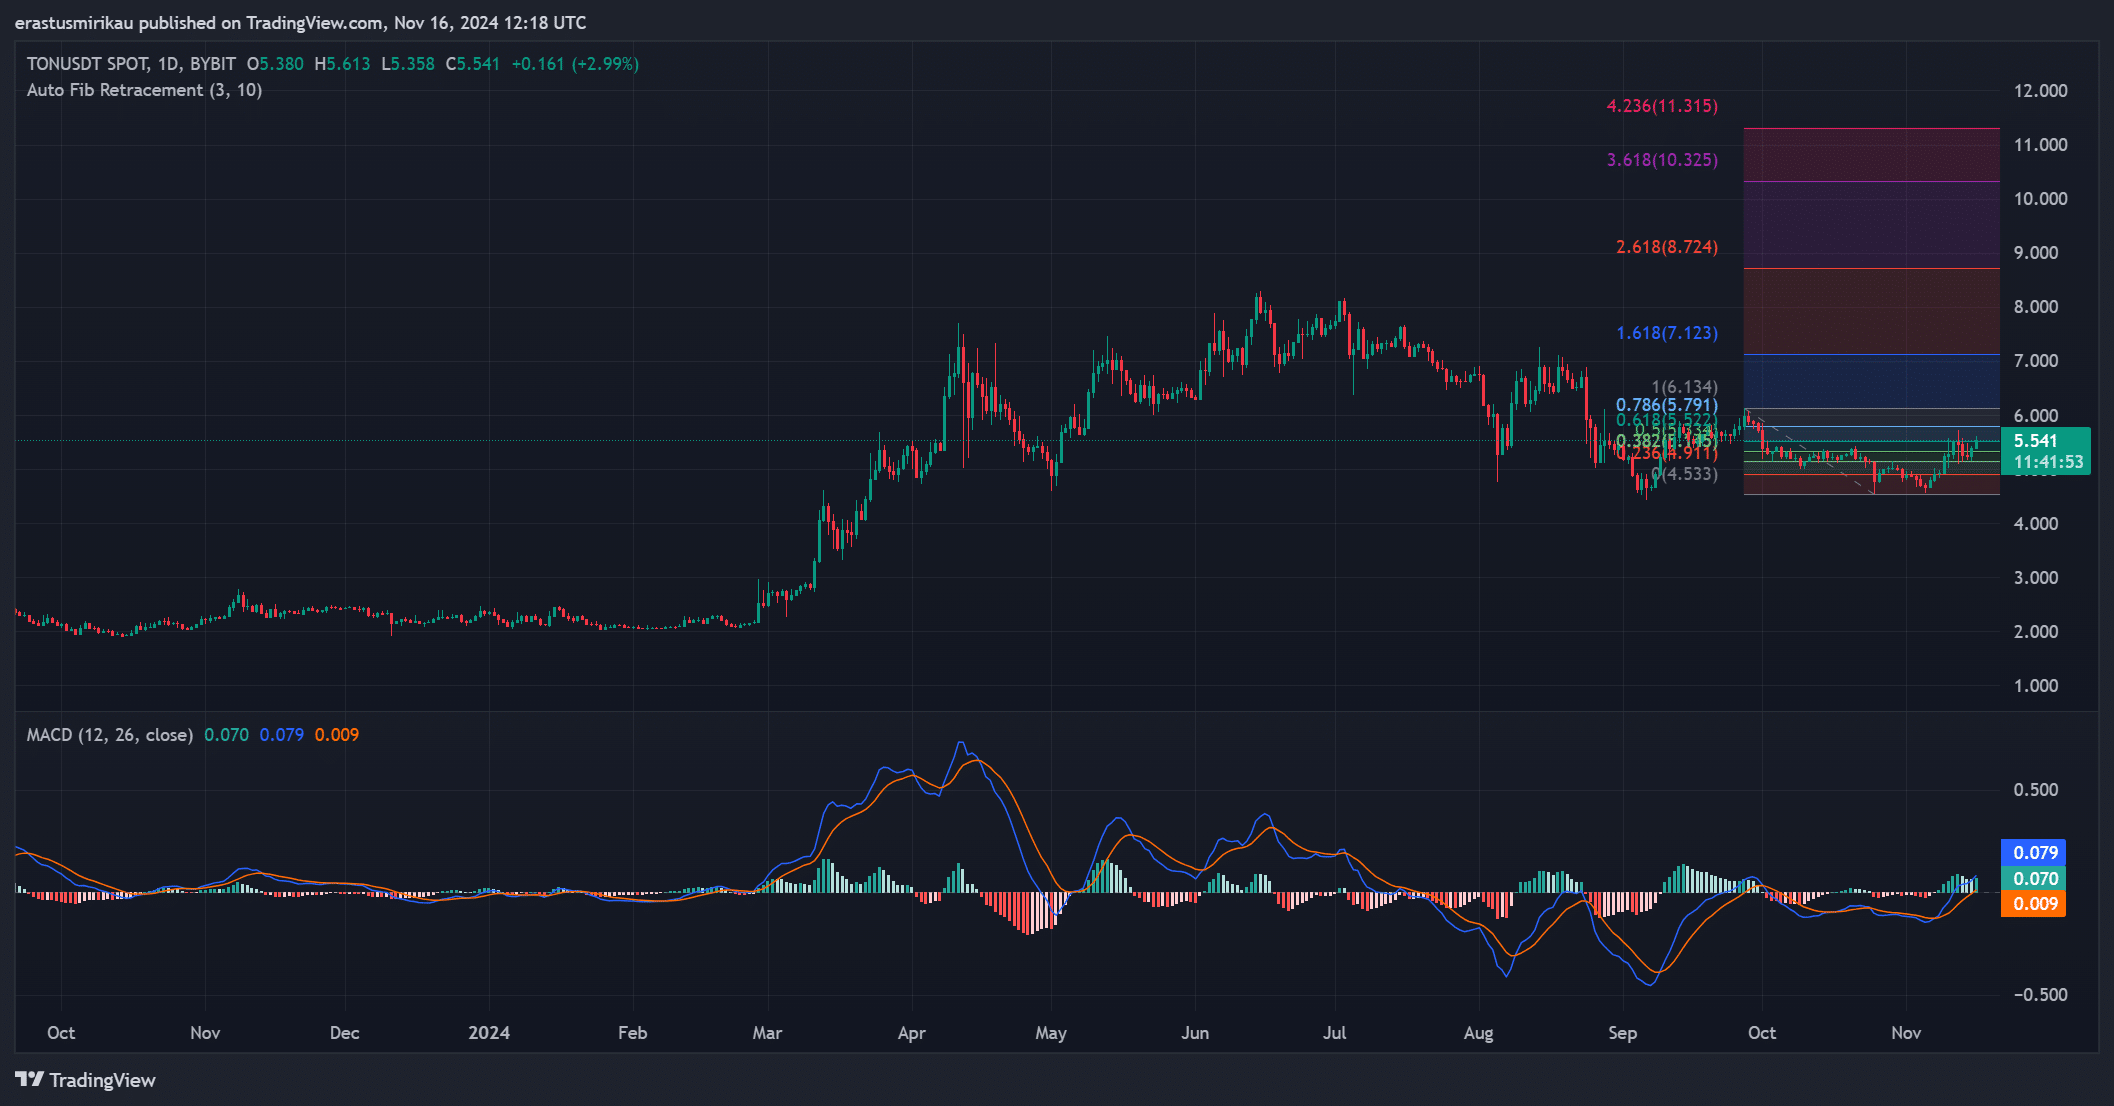
Technical indicators painted a bullish picture. The Fibonacci retracement levels showed Toncoin reclaiming the 0.786 level at $5.79, with the 1.618 extension at $7.12 acting as the next key target.
The 2.618 Fibonacci level at $8.72 aligned with bullish projections, further supporting the $8.30 target.
Additionally, the MACD indicator confirmed increasing momentum. Specifically, the MACD line was at 0.079, while the signal line stood at 0.070, creating a bullish crossover.
Furthermore, the histogram has shifted positively, rising to 0.009, indicating strengthening buying pressure. These figures highlight that momentum is building, which could propel prices higher in the near term.


Source: TradingView
On-chain signals highlight investor confidence
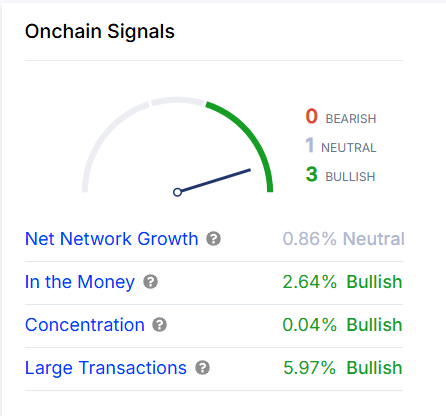
On-chain data added to the optimistic narrative. While Net Network Growth remained neutral at 0.86%, other metrics show clear bullishness.
For instance, the In the Money metric indicated 2.64% bullish, signaling that more holders are in profit.
Furthermore, whale concentration and large transactions, up by 0.04% and 5.97%, respectively, reflected growing confidence among high-value investors.


Source: IntoTheBlock
Market activity is surging
Liquidation data underscored Toncoin’s increasing market interest. At press time, $79.91K in shorts and $35.85K in longs have been liquidated.
This suggested heightened trading activity as traders positioned themselves for TON’s next move.


Source: Coinglass
Is your portfolio green? Check out the TON Profit Calculator
With bullish technical indicators such as the MACD crossover, rising Fibonacci targets, and strong on-chain metrics, TON is well-positioned to breach $6.03 and target $8.30.
Therefore, if momentum persists, Toncoin could catalyze a broader market rally, firmly establishing its upward trend. The next few days will be critical for confirming this bullish trajectory.

